
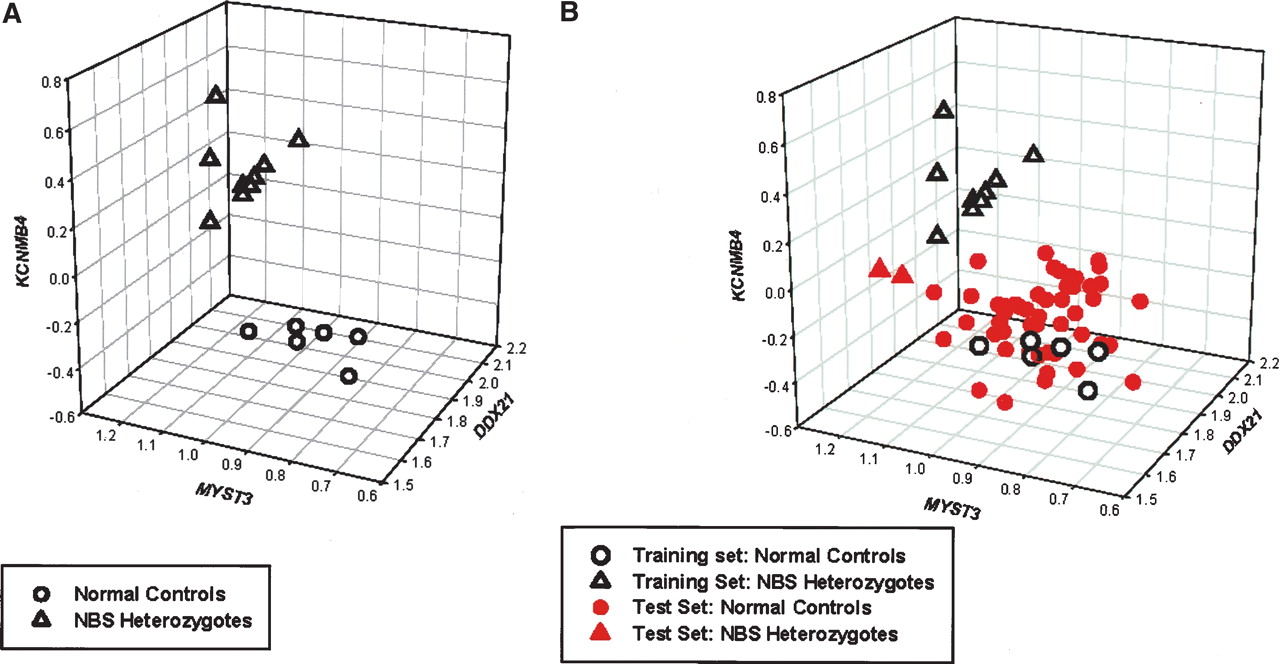
Figure 3.
Expression level of three genes (DDX21, MYST3, KCNMB4) for (A) 16 normal controls and nine NBS carriers, and (B) same individuals as in A and 50 additional normal controls and two additional NBS carriers. Some data points overlap each other because some of the individuals have very similar expression levels of these genes.


