
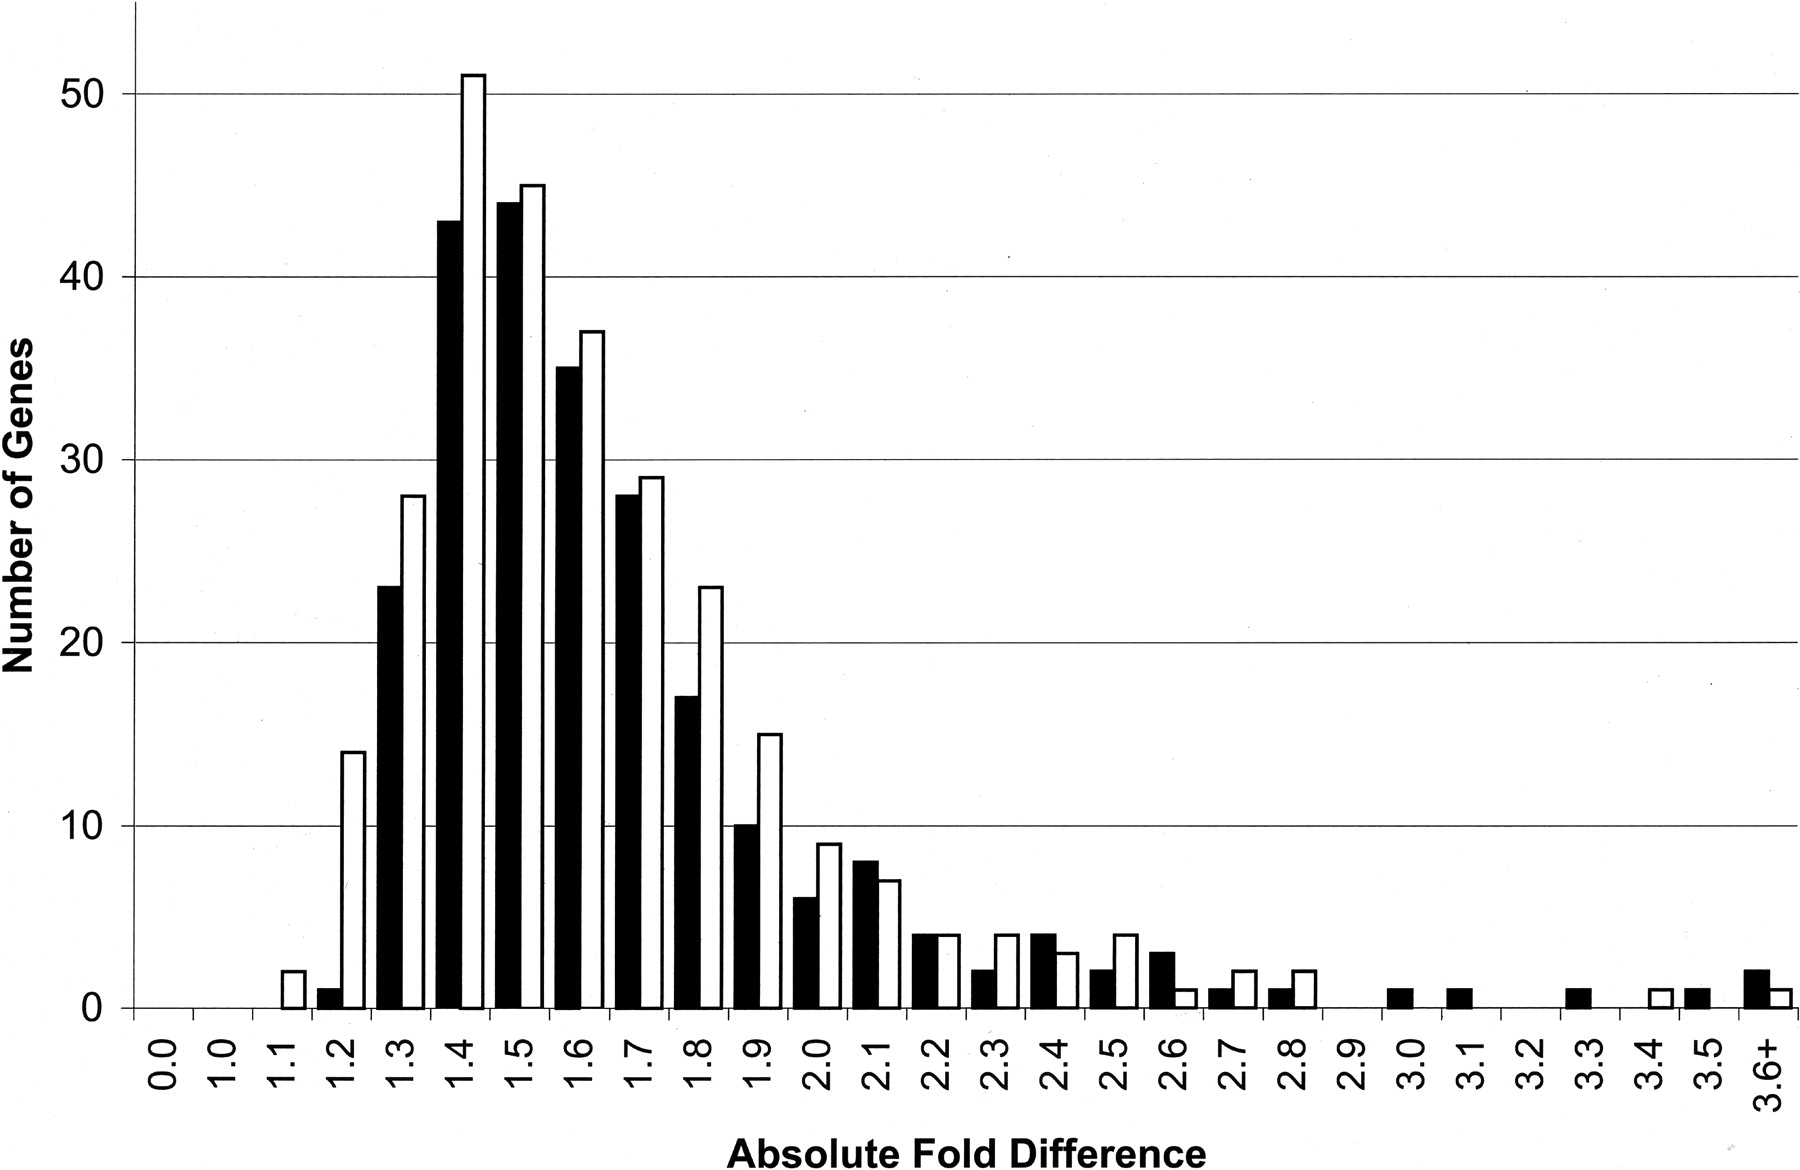
Figure 1.
Distribution of fold differences for 520 differentially expressed genes (P ≤ 0.001) between normal controls and NBS carriers. Genes whose expression levels are higher among NBS carriers are shown by the white bars, and those whose expression levels are lower among NBS carriers compared to normal controls are shown in black.


