
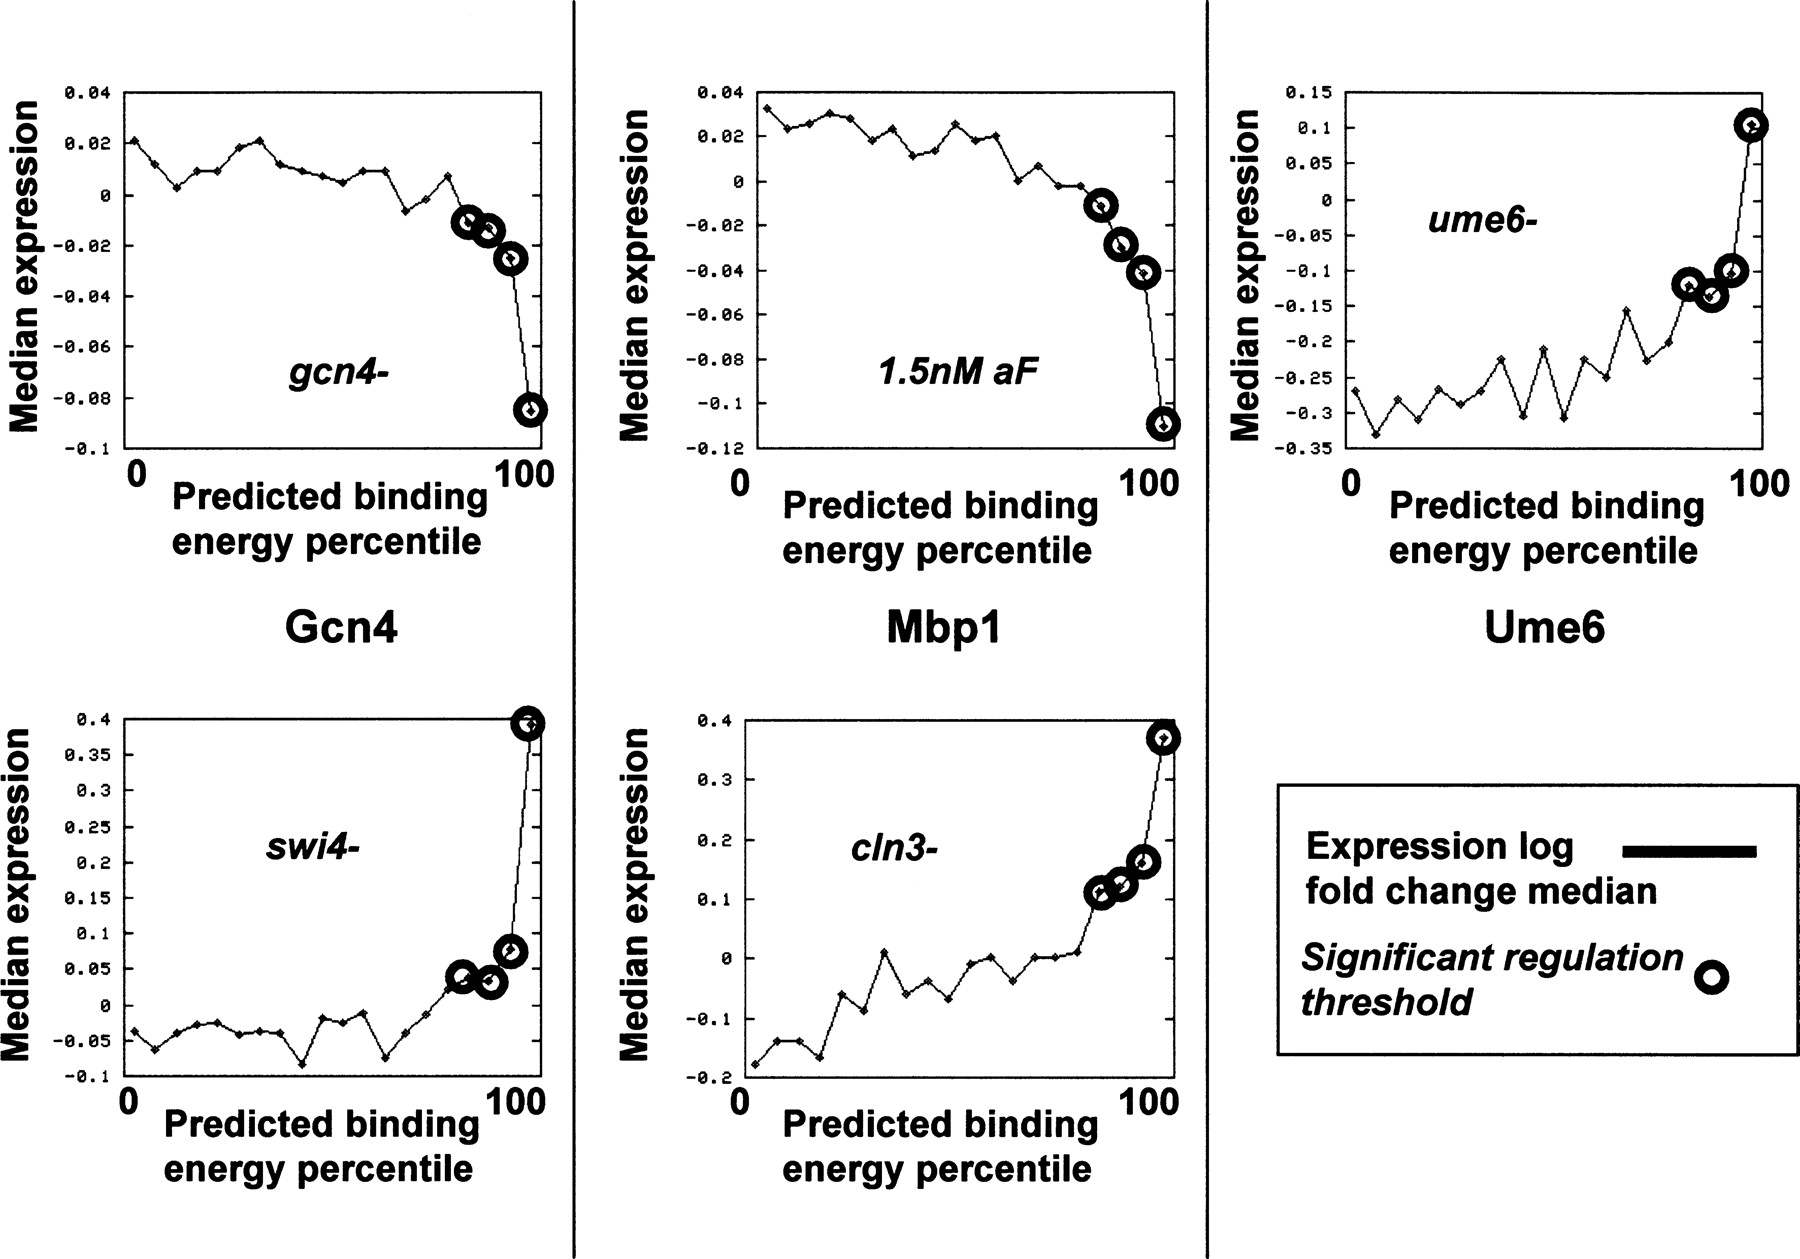
Figure 6.
Low-affinity promoters generate gene expression. Shown is the gene expression generated by promoters with low (left) to high (right) predicted TF-binding energies. (x-axis) Percentile of predicted TF-binding energy. (y-axis) Median of log fold expression changes in bins of 5 affinity percentiles. The experimental condition is different for each plot and is noted on the graph. Bins that represent significant up- or down-regulation (Methods) are labeled in circles. The plots suggest that some TFs (e.g., Gcn4, Mbp1) may weakly affect the expression of a substantial number of genes even when clear binding sites are lacking.


