
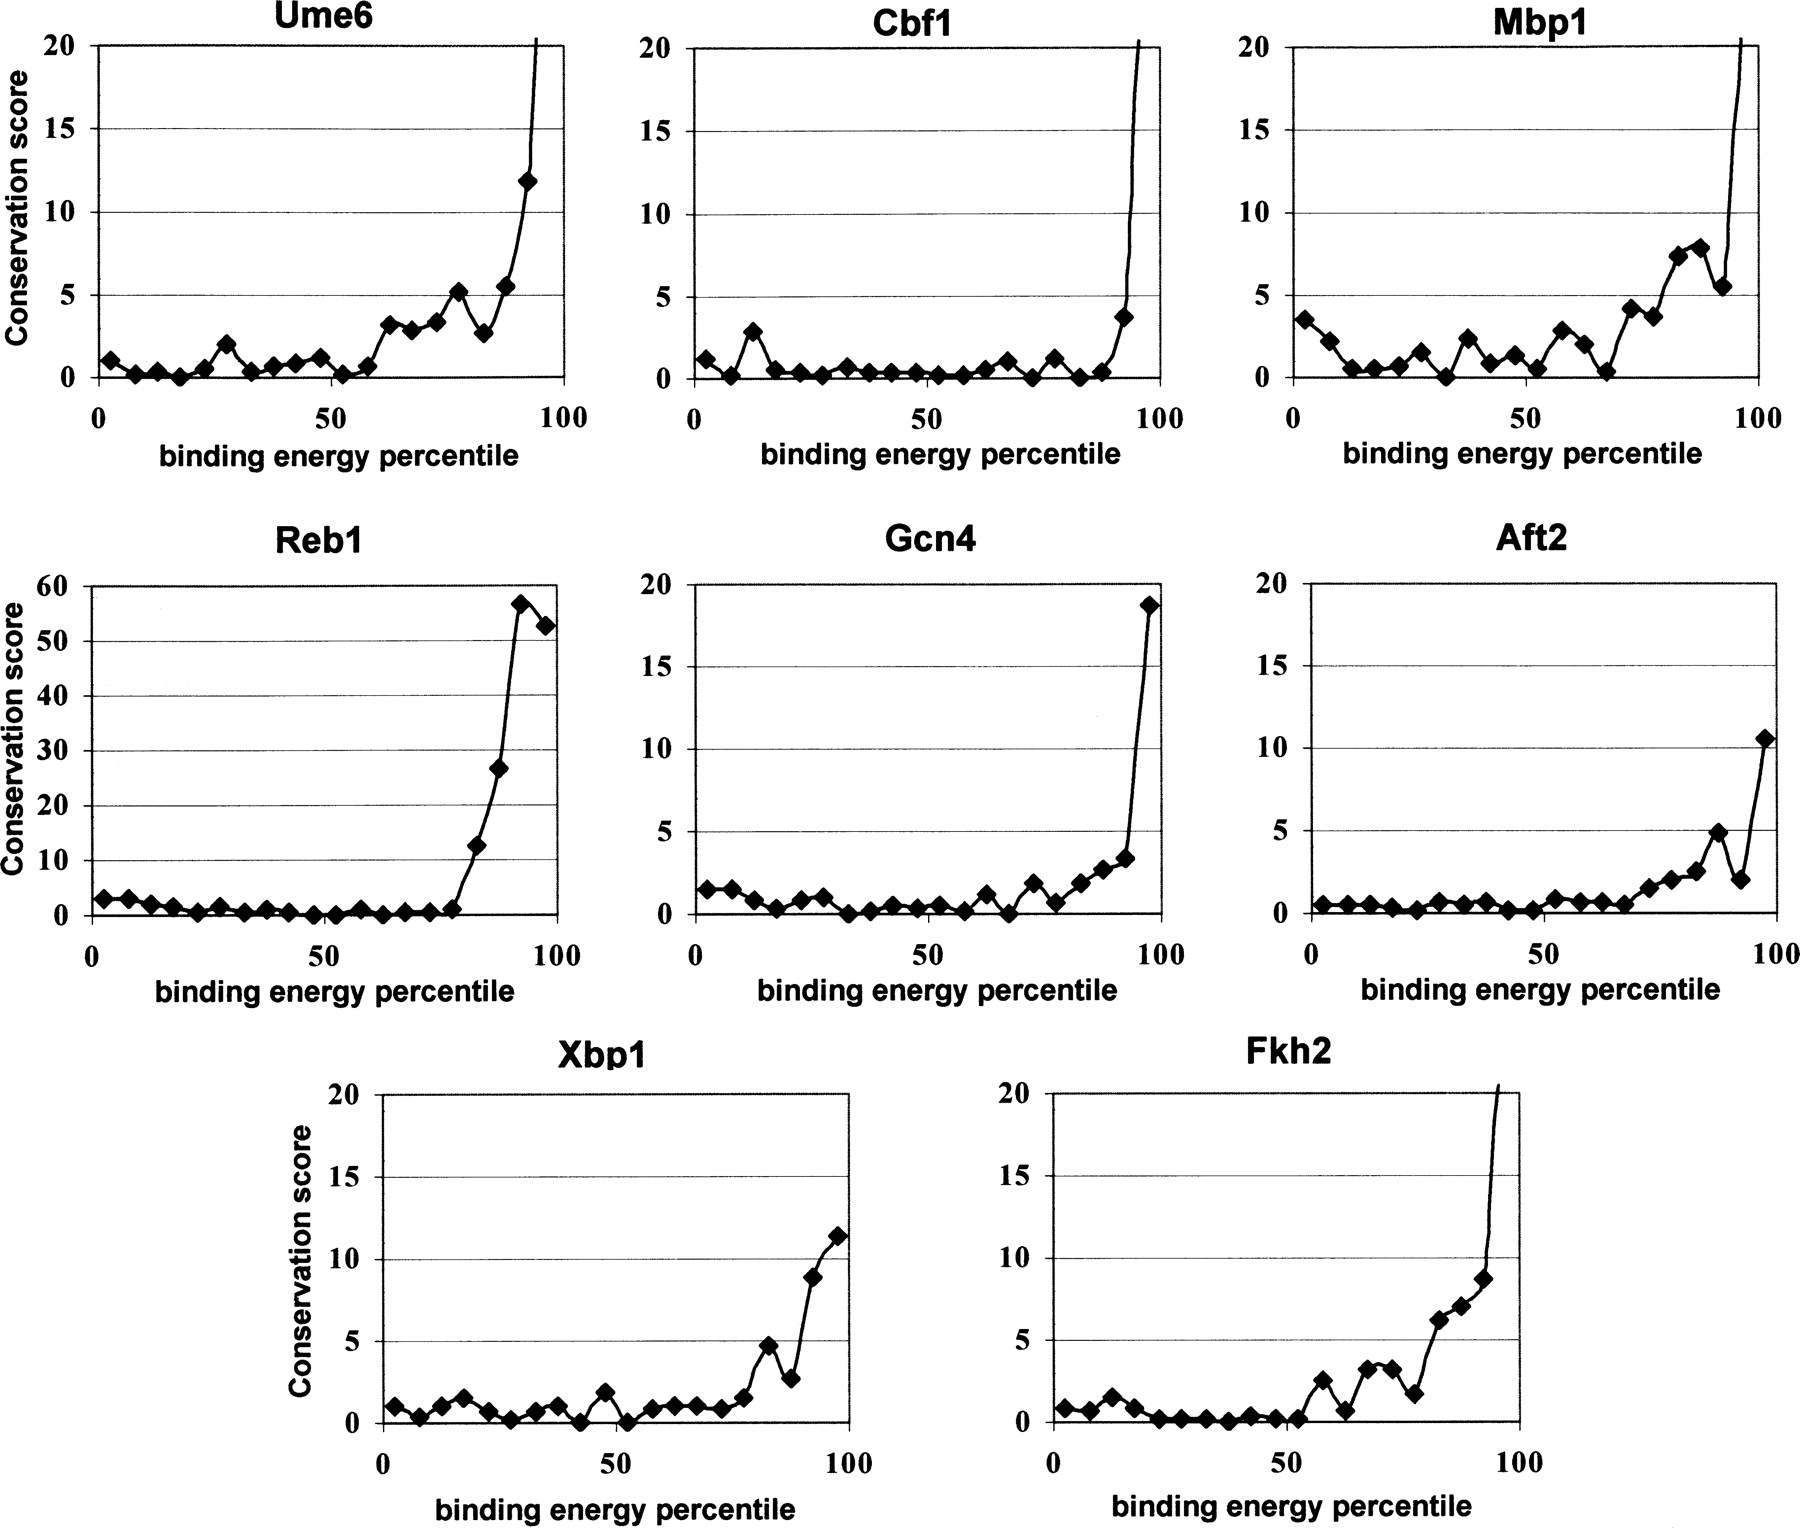
Figure 5.
Evolutionary conservation of predicted binding energies. Plotted are the conservation scores of genes with low (left) to high (right) TF-binding energies. (x-axis) S. cerevisiae binding energy percentile. (y-axis) Conservation score (Methods). In all cases, the binding energies of higher-affinity promoters are conserved. For several of the TFs, conservation is observed on a significant fraction of the genome (10%–20%), reflecting widespread selection on the binding energy of promoters lacking high-affinity binding sites.


