
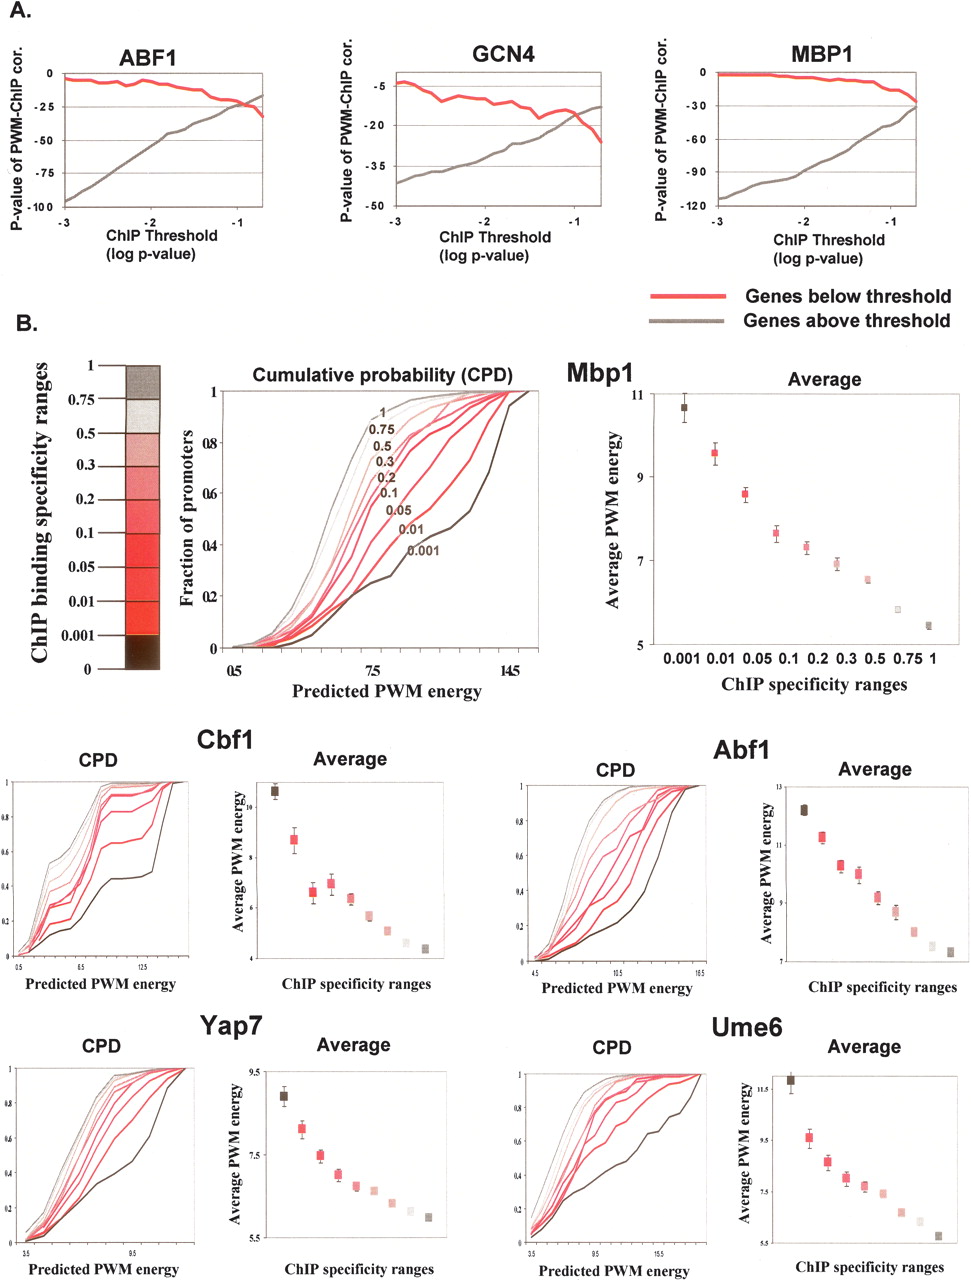
Quantitative ChIP to sequence correlation. (A) ChIP and PWM correlation above and below a P-value threshold. Shown are log P-values of the Spearman correlation between ChIP binding ratios and PWM energy predictions (y-axis). Using a range of possible thresholds (x-axis), correlations were computed separately for genes with ChIP values below (red) and above (black) the threshold. In all cases, a significant correlation is observed in both sets of genes, and for all selections of thresholds. (B) Sequence–ChIP correlation reveals in vivo low-specificity binding. Shown are averages and cumulative probability distributions (CPDs) of PWM binding energies for groups of genes with ChIP values within certain intervals. Remarkable monotonicity is observed in all cases, with predicted energies of groups with higher-significance P-values (left) consistently higher than those of groups with less-significant P-values (right). The monotonicity is holding for very low specificity ranges, suggesting ChIP profiles are informative over a wide dynamic range of specificities.


