
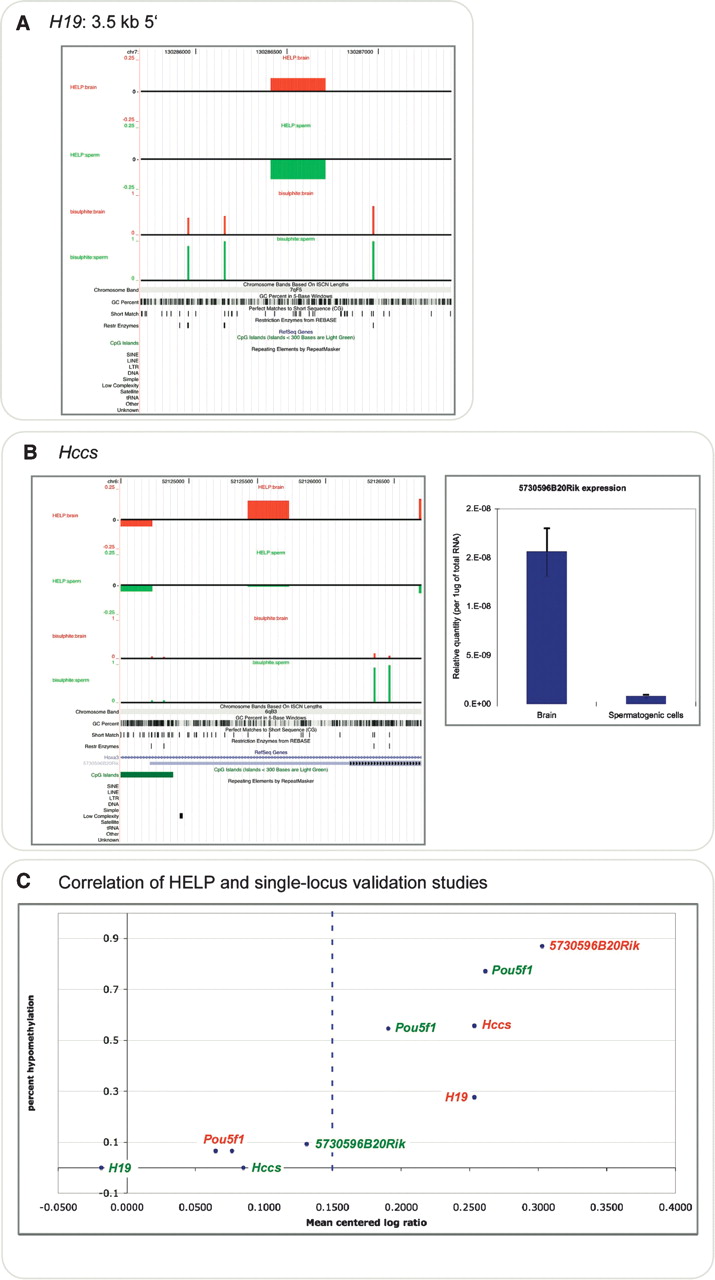
Validation studies using bisulfite pyrosequencing. The H19 locus indicated by the orange arrowhead in Fig. 4 was tested for cytosine methylation using bisulfite pyrosequencing of the original DNA samples used for the HELP assays. The samples from each of the three mice were tested individually. The primary data are provided in Supplemental Table 1, and are represented here as the median value of the three generated. The figures were generated by creating custom tracks for the UCSC Genome Browser and can be browsed in detail at http://greallylab.aecom.yu.edu/~greally/wiggle_tracks/HELP_data.htm. The degree of cytosine methylation is plotted as a percentage for spermatogenic cells (green) and brain (red). The HELP data are shown for reference using the same color scheme. (A) The complete methylation of the HpaII sites at the H19 locus in spermatogenic cells is consistent with the methylated categorization in the HELP assay and with prior studies of this region in spermatogenic cells (Davis et al. 1999). The downstream HpaII site is more methylated in brain than the upstream site. As the proportion of molecules digested and available for amplification in the HELP assay is dependent on the digestion of both flanking sites, the site with the greater degree of methylation determines this proportion. We conclude that the 72.4% methylation of this site allowed the HELP representation categorized as hypomethylated. (B) The Hccs promoter shows clear differences in cytosine methylation between tissues at all HpaII sites tested, with a corresponding change in gene expression levels. (C) Correlation of all of the loci plotted by hypomethylation (bisulfite pyrosequencing data) against normalized HpaII/MspI ratios, with results from brain samples (red) and spermatogenic cell samples (green) shown.


