
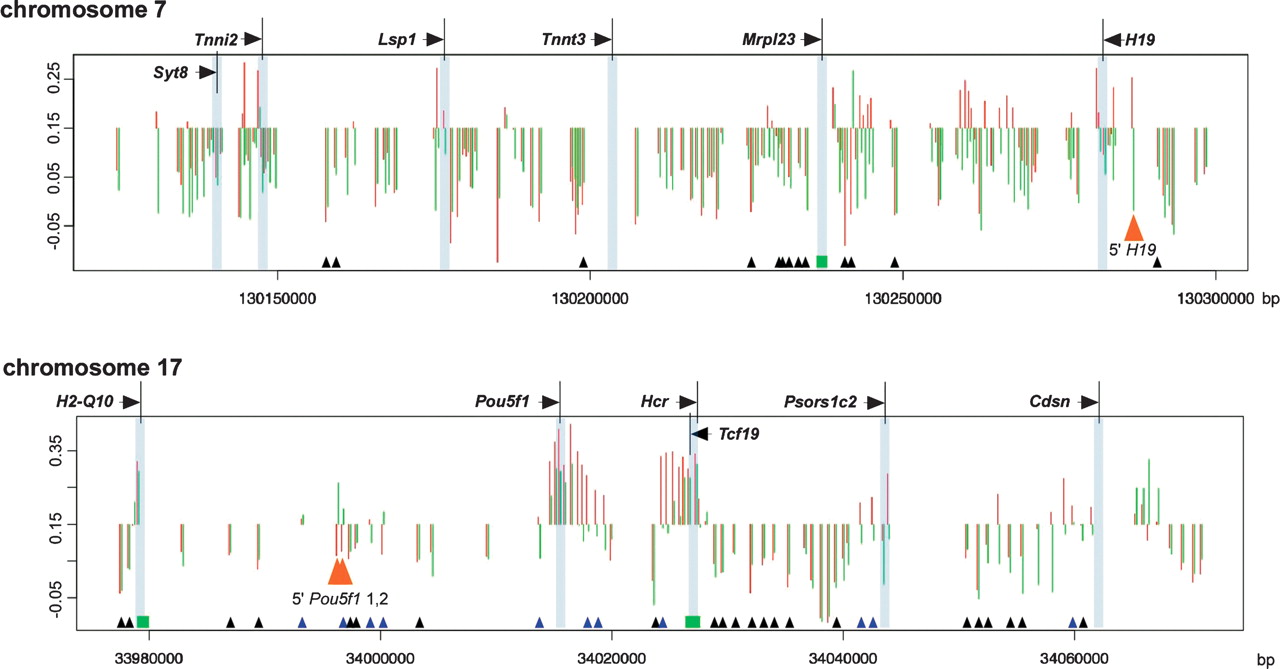
Intragenomic profiling and intergenomic comparisons for two chromosomal regions. The HpaII/MspI log ratios are depicted in terms of their deviation from the threshold value of 0.15. A downward deflection is indicative of a methylated locus, and an upward deflection is a relatively hypomethylated locus. (Red) Brain cells, (green) spermatogenic cells. Transcription start sites are shared, CpG islands are represented (green rectangles), and loci for which the fragment has one or both flanking HpaII sites located in a repetitive element are depicted (small triangle at the bottom of the graph). (Black triangles) Methylated, (blue) hypomethylated in at least one of the tissues tested. (Orange) Loci subsequently tested by bisulfite pyrosequencing. The red and green histograms are slightly shifted relative to each other for clarity. The intragenomic profile of cytosine methylation shows that methylation is the predominant pattern in these regions, with short blocks of hypomethylation located mostly at promoters and CpG islands, although some non-promoter, non-CpG island hypomethylation is also apparent. The intergenomic comparison between tissues shows overall concordance but some clear tissue-specific differences, such as those at the orange arrowheads.


