
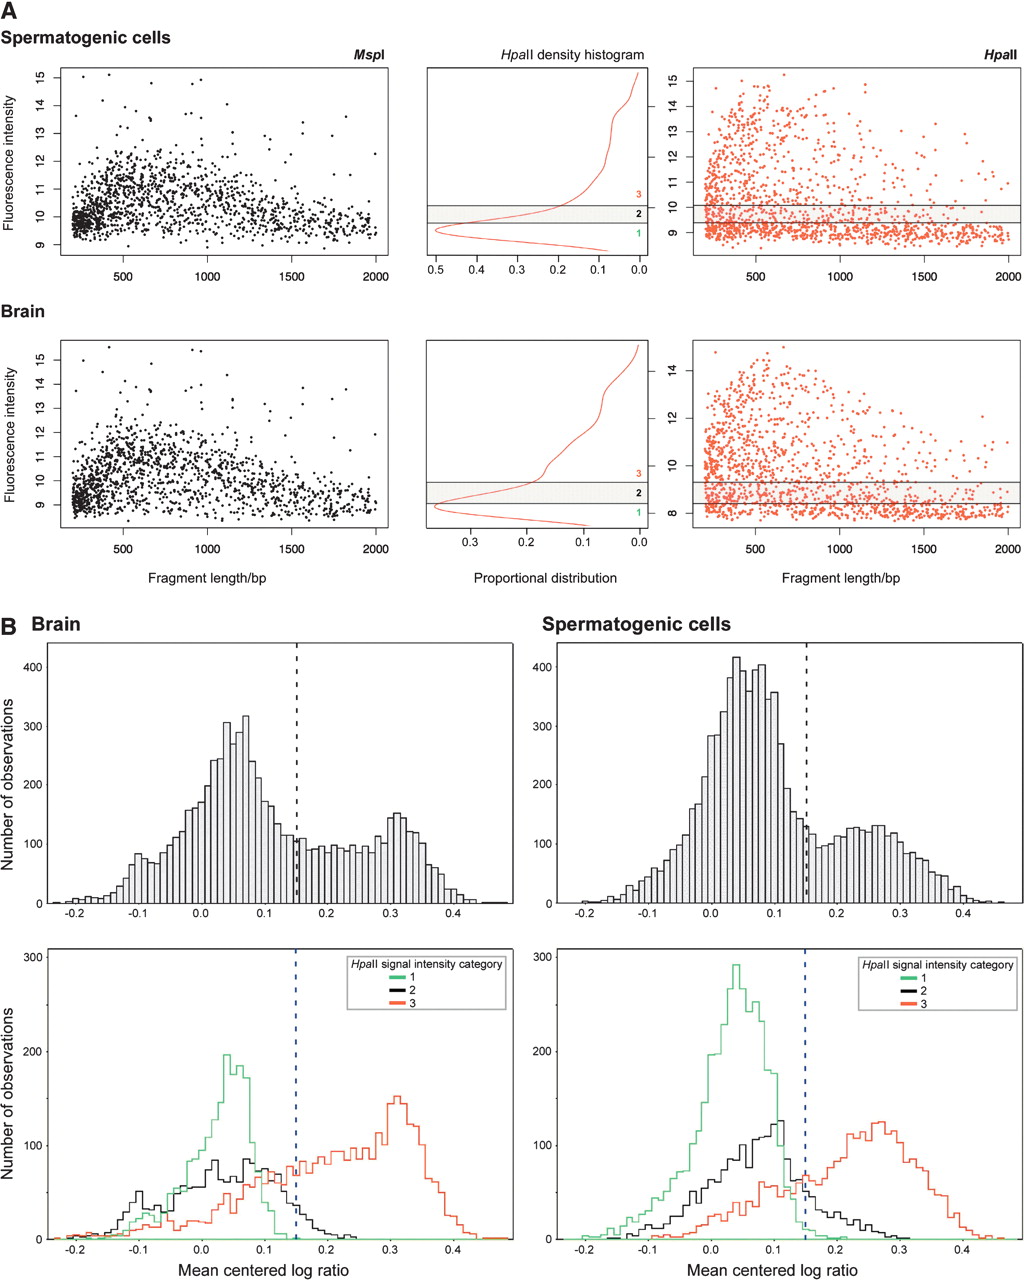
(A) Microarray signal characteristics for MspI (black) and HpaII (red). The signal intensities mirror the relative amount of product across the range of sizes in the PCR amplification. The HpaII representation shows the additional characteristic of a population of loci with low signal intensities, likely to represent the more methylated loci in the sample. A mixture model applied to the distribution allows loci to be categorized according to their relative signal intensities (center panel). (B) When the normalized mean HpaII/MspI log ratios are plotted as density histograms for each tissue, two populations of loci are apparent: the majority have low ratios, with a minority falling into a higher distribution. The breakdown of the log ratios by HpaII signal intensity category shows the low ratio peak to be mostly composed of those loci with lower HpaII signal intensities. In both tissues, a threshold of ∼0.15 serves to distinguish these two distributions.


