
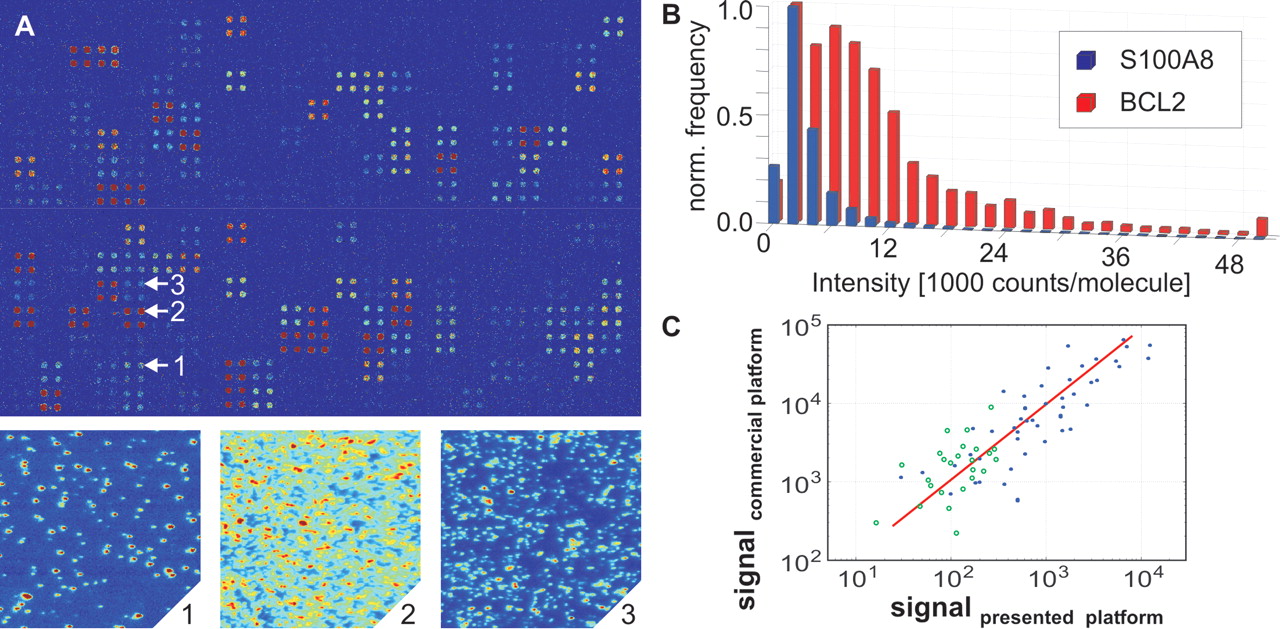
Hybridization of cDNA synthesized from 200 ng total RNA. (A) The microarray was scanned with a pixel size of 200 nm and plotted after software-binning (25 × 25). Details 1–3 show hybridized cDNA molecules at full 200-nm resolution. Binding of low-abundant cDNAs, e.g., BCL2 (1) and S100A8 (3), was quantified by molecule counting, high-abundant, e.g., VAV1 (2), by conventional ensemble analysis. (B) Due to differences in the labeling, the brightness of individual cDNA molecules was found to vary significantly. The histogram shows the brightness of individual cDNA molecules detected on the microarray shown in A for BCL2 (red) and S100A8 (blue). To determine the degree of labeling we measured the brightness of single fluorophores by repeatedly scanning the same area on the chip surface. Due to the multiple labeling of the cDNA, photobleaching occurred in multiple steps. From the magnitude of the last step, the single fluorophore brightness was calculated. For BCL2 and S100A8, a respective average labeling degree of 4.6 and 1.6 dyes per cDNA molecule was found. (C) Comparison with a commercial platform. Data obtained on 200 ng of total RNA using the presented platform were analyzed by measuring the mean fluorescence per pixel (blue dots) and by counting individual molecules per spot for surface densities smaller than 1000 molecules per spot (green circles). When both types of analysis were feasible, the method yielding less variation in eight replicates was selected. For comparison, mean fluorescence intensity values are plotted in units of molecules per spot, by normalizing with the average brightness of individual cDNA molecules. A 100-fold higher concentration of the same sample was analyzed using a commercial system (substrate: Schott Nexterion; confocal reader: ScanArray 4000, Perkin Elmer). For each gene, the result of the ultrasensitive system (x-axis) is plotted against the result of the commercial system (y-axis). The data were found to correlate well, yielding a linear Pearson correlation coefficient of 0.85. (see Supplemental Tables S2 and S3, which contain a list of all results).


