
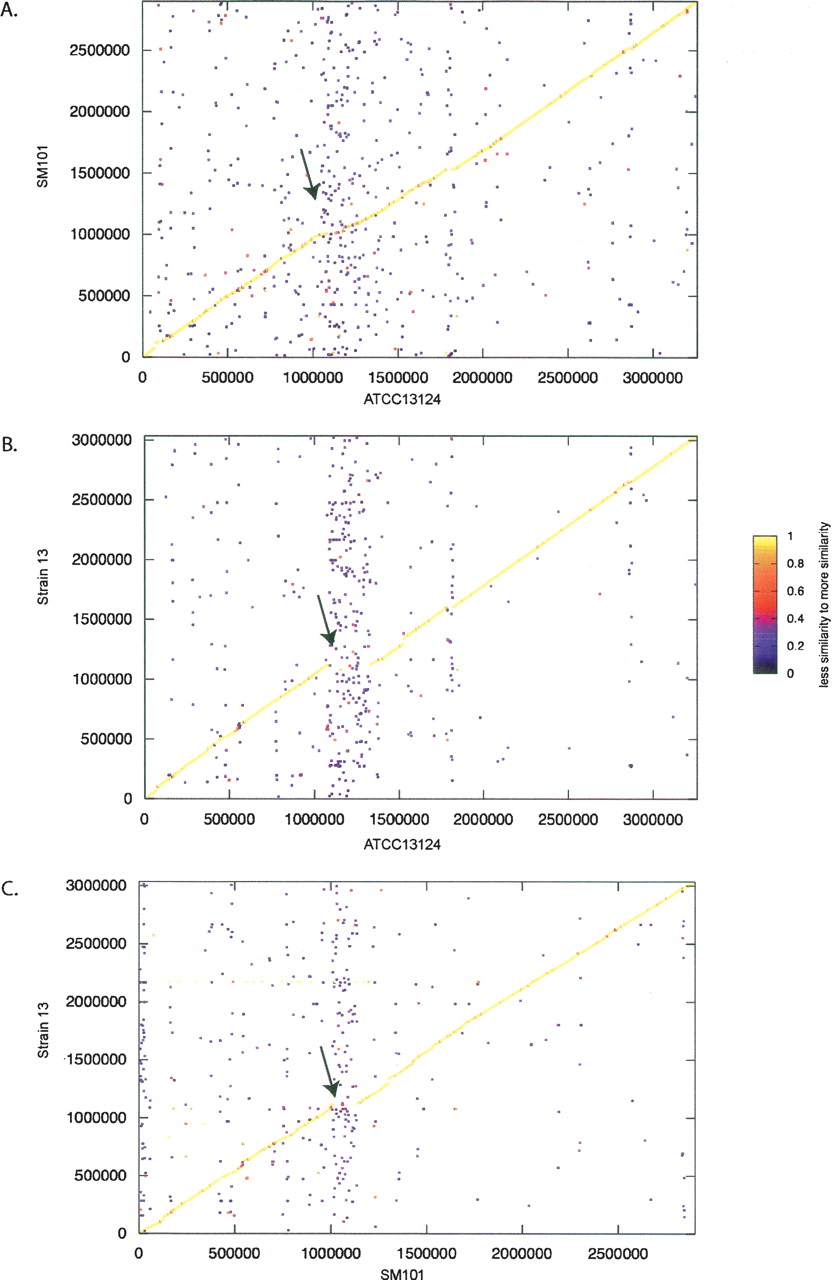
Figure 2.
Synteny plots using the BLAST Score Ratio method (Rasko et al. 2005). (A) ATCC 13124 vs. SM101. (B) ATCC 13124 vs. Strain 13. (C) SM101 vs. Strain 13. Each plot point represents a single peptide in the indicated C. perfringens genome pair. The color of each point indicates the level of similarity of that peptide in each genome pair, according to Rasko et al. (2005). Arrows indicate the 242,969-bp island.


