
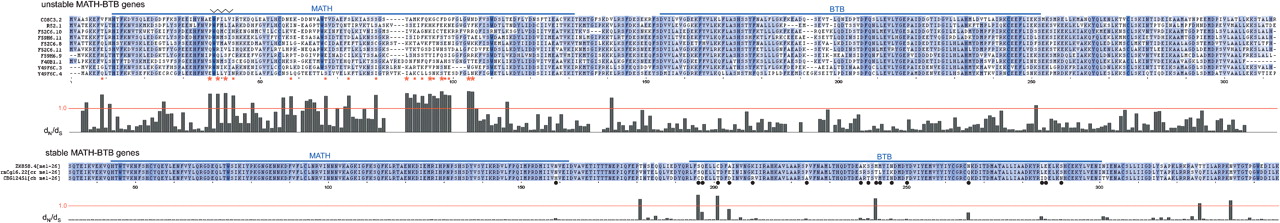
dN/dS results for MATH-BTB genes. Alignment and maximum-likelihood dN/dS values for a set of 10 unstable MATH-BTB proteins from C. elegans (top panel) and proteins from one stable ortholog trio, C. elegans (mel-26), C. briggsae (cb mel-26), and C. remanei (cr mel-26) (lower panel). The MATH and BTB domains are marked above the alignments. Blue alignment shading is proportional to the sum-of-pairs score for each amino acid residue relative to its aligned column. The histogram part of each panel shows estimated dN/dS values for each gap-free alignment column, with a red line indicating a value of 1.0. Sites under probable positive selection are marked with a red asterisk (P ≥ 0.9) or red square (P ≥ 0.8). In the lower panel, sites with an amino acid change in any of the three sequences in the MATH or BTB domains are marked with a black dot.


