
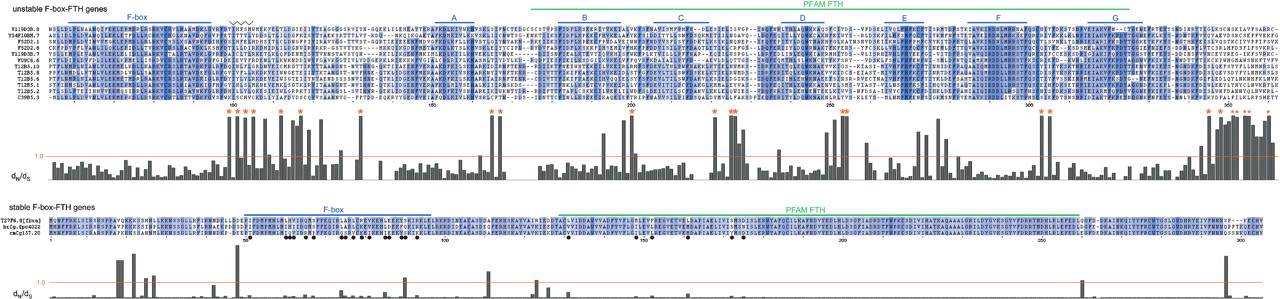
dN/dS results for F-box-FTH genes. Alignment and maximum-likelihood dN/dS values for a set of 12 unstable F-box-FTH proteins (top panel) and one stable ortholog trio of F-box-FTH proteins (lower panel). The F-box domain and conserved segments (A–G) of the extended FTH domain are marked above the top alignment. The jagged line indicates the position of a possible β-strand. Blue alignment shading is proportional to the sum-of-pairs score for each amino acid residue relative to its aligned column. The histogram section of each panel shows estimated dN/dS values for each gap-free alignment column, with a red line indicating a value of 1.0. Sites under probable positive selection (P > 0.9) are marked with a red asterisk; the five sites near the C terminus have a smaller asterisk to indicate the possibility of misalignment. Evidence for positive selection remained highly significant when this section was removed prior to analysis (data not shown). To avoid investigator bias, the alignments shown were not hand-modified—a few places with possible artifactual alignment are apparent (e.g., misaligned R residues near the N-terminal end of the PFAM-designated FTH domain in the top panel). In the lower panel, black dots below the alignment indicate sites with an amino acid change in any of the three proteins in the F-box or FTH domains.


