
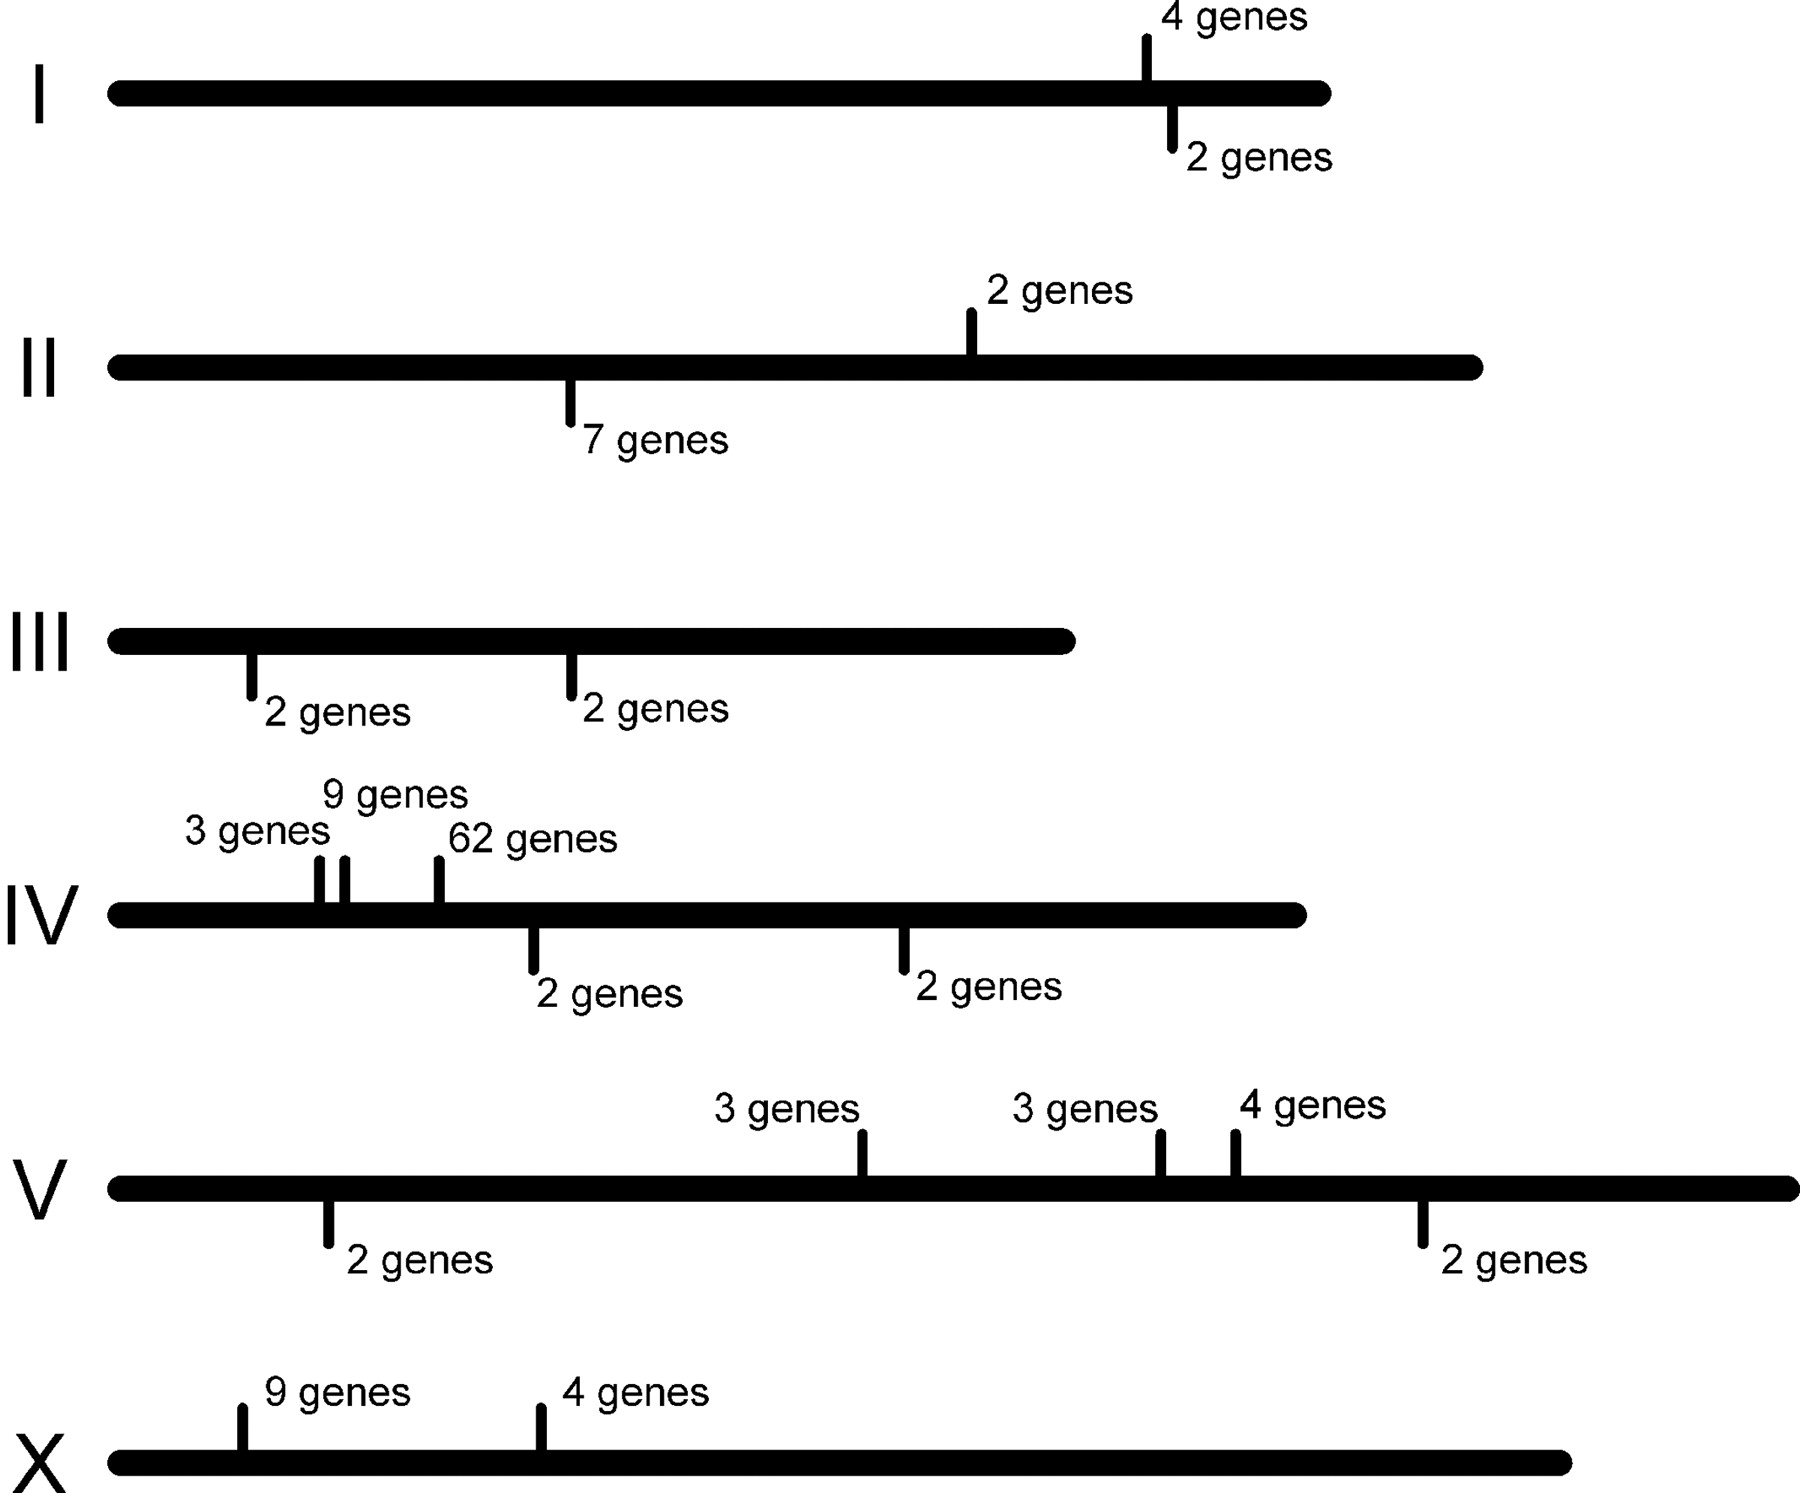
Figure 4.
Clusters of genes whose transcript levels are altered following infection with M.nematophilum. Chromosomes are represented as black bars and the position and number of up-regulated (above chromosome) or down-regulated genes (below chromosome) are illustrated.


