
GO categories (with >39 genes) containing genes that appeared in clusters of retained genes more than expected based on whole-genome retention frequencies
Click on table to view larger version.
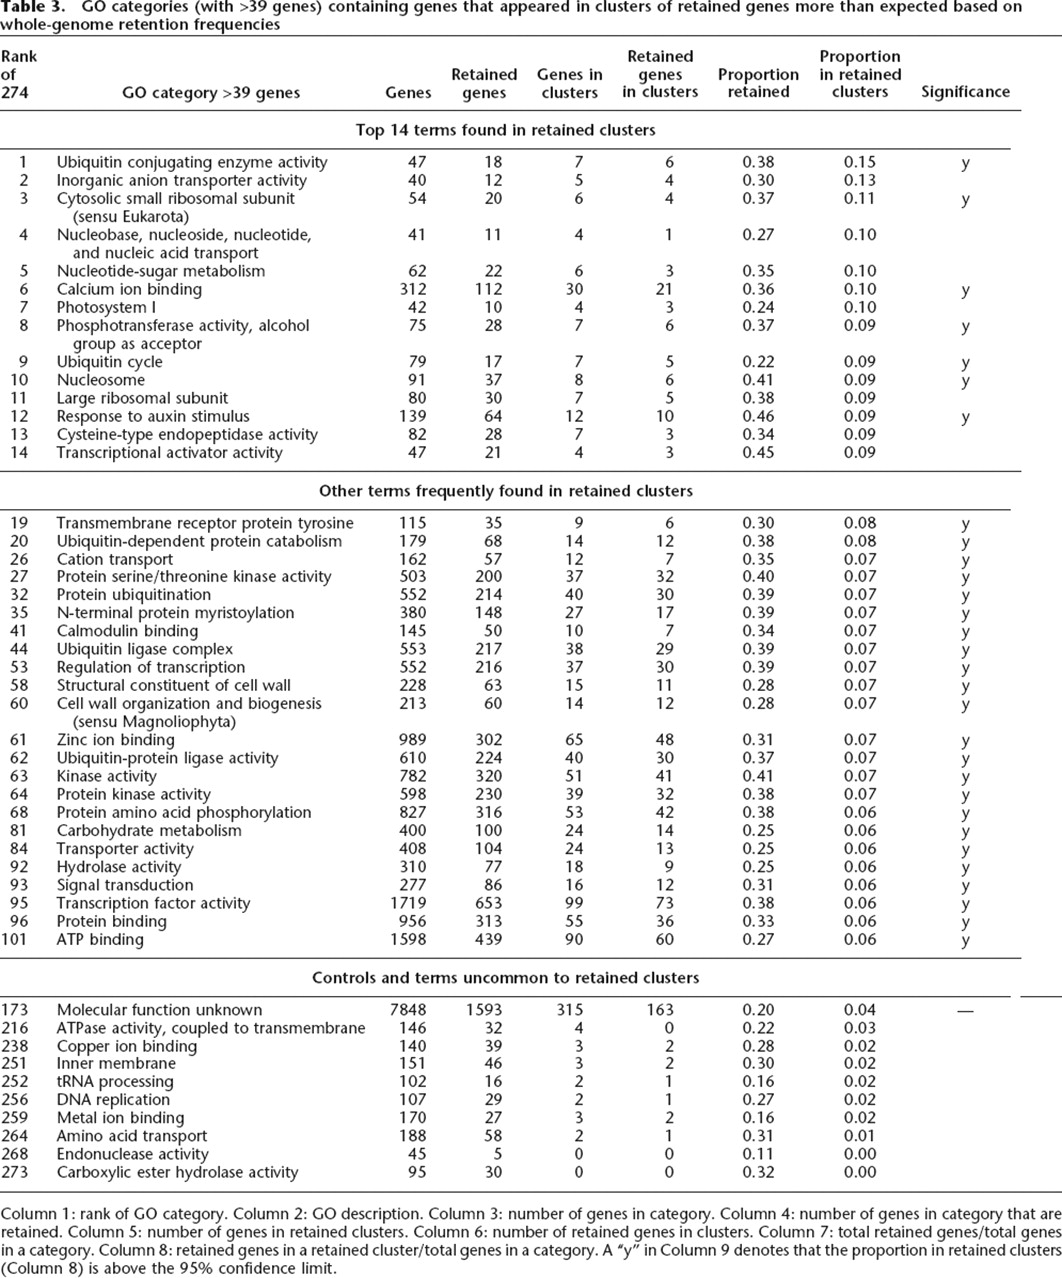
Column 1: rank of GO category. Column 2: GO description. Column 3: number of genes in category. Column 4: number of genes in category that are retained. Column 5: number of genes in retained clusters. Column 6: number of retained genes in clusters. Column 7: total retained genes/total genes in a category. Column 8: retained genes in a retained cluster/total genes in a category. A “y” in Column 9 denotes that the proportion in retained clusters (Column 8) is above the 95% confidence limit.


