
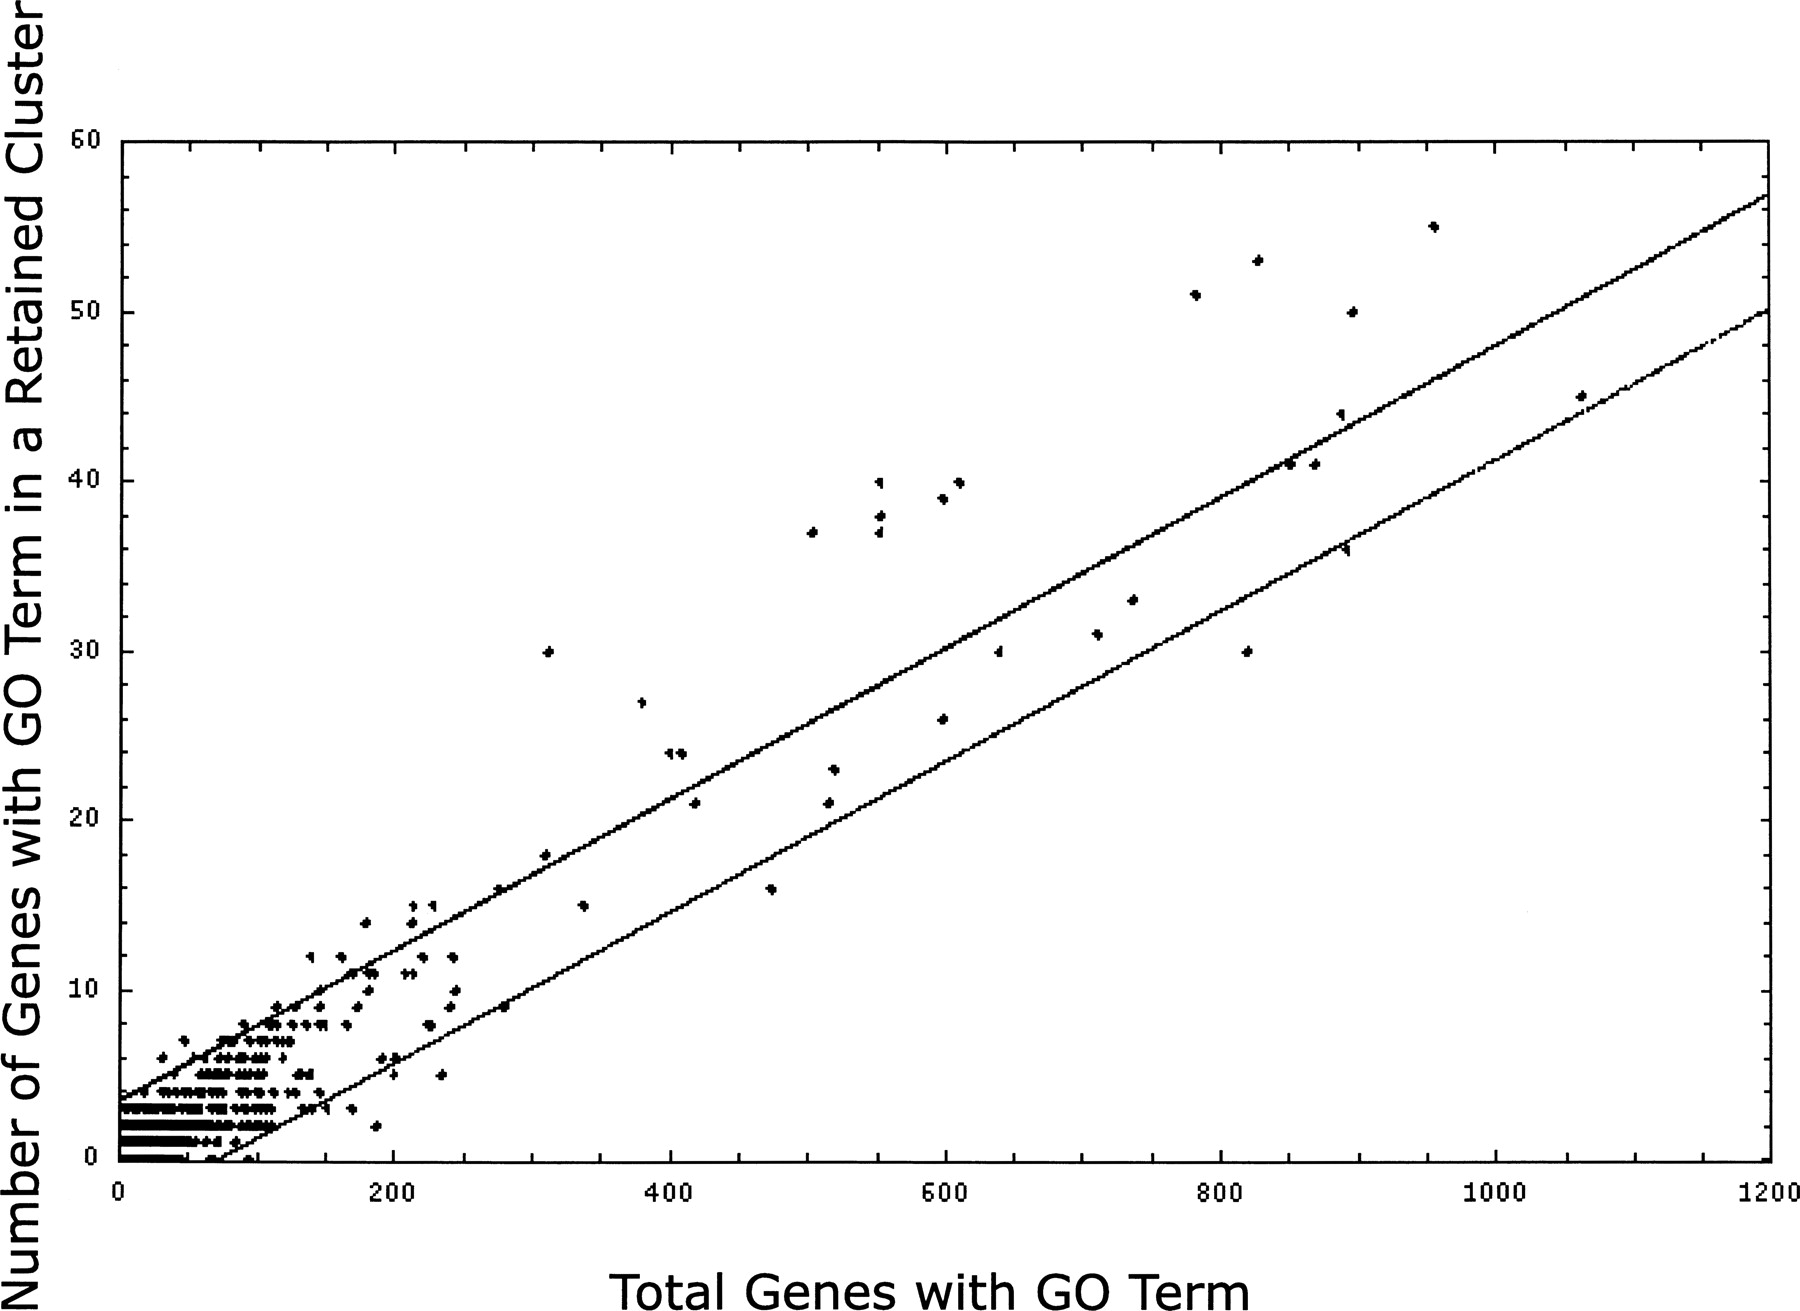
GO categories evaluated for overabundance in clusters of retained genes as compared to retention expectations of the GO category treated independently. GO terms with fewer than six genes in retained clusters were omitted. Linear regression analysis of the scatterplot of all GO data plotted: the x-axis is the number of genes and the y-axis is the number of these genes positioned within retained cluster space. Using column headings from Table 1: X is the “Retained Frequency” and Y is the “Genes >95%, In Retained Clusters.” Points (individual GO terms) above the upper 95% confidence interval line are those terms found significantly more often than expected in clusters of retained genes.


