
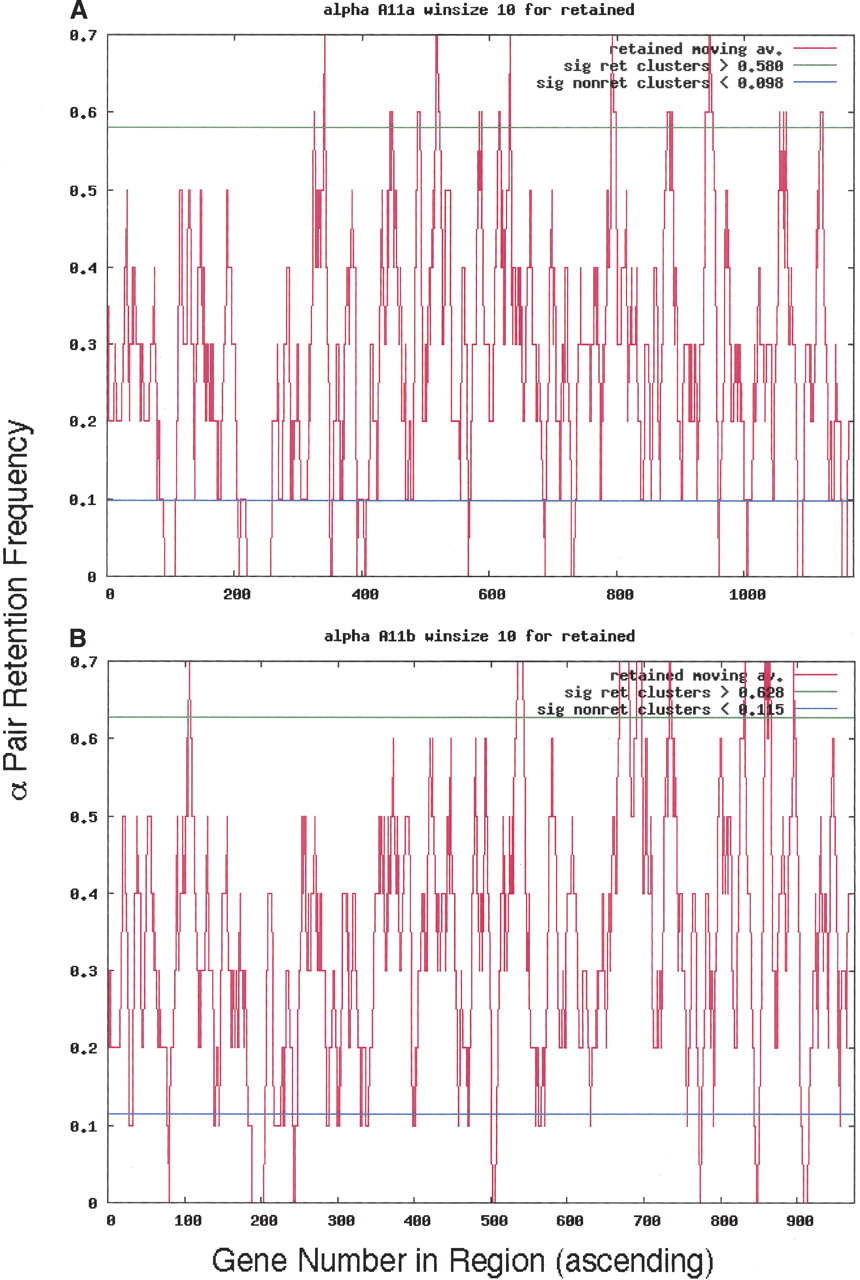
Figure 4.
Moving average cluster plots for both α11 homeologous chromosomal segments using a 10-gene window. (A) Homeolog 11a. (B) Homeolog 11b. The y-axis is retention frequency; 1.0 means that all 10 genes were retained in that window. The x-axis is the sequence of genes in the Minimized α-region homeolog, as explained in Methods. In α11a, for example, there are 67 and 92 genes, retained and non-retained genes, respectively (Table 1, Row 11, columns “Genes >95%” and “a”).


