
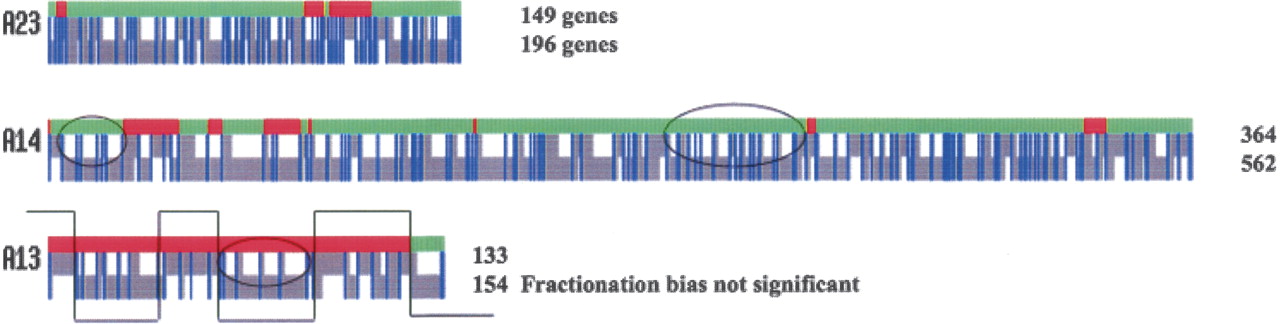
Three representative homeolog alignments showing different levels of fractionation bias. (A23) Typical α-region showing significant fractionation bias. (A14) Very significant fractionation bias. (A13) Insignificant fractionation bias. Each diagram is color-coded: retained genes are blue vertical lines, non-retained genes are gray vertical lines, and gaps are white space. The green-red bar above each block denotes the strand of the BLAST HSP, +/+ (green) and +/− (red) using the convention that the lower chromosome number of the pair is defined as intact, with the homeolog inverted to reconstitute synteny. The overfractionated homeolog has fewer genes than the underfractionated homeolog (Table 1), as expected and noted to the right of each alignment. There are no gaps >20 bp in these alignments. Gaps (white space) indicate the disparity between the numbers of non-retained genes on homeolog pairs. Ovals enclose particularly obvious clusters of retained genes that are much closer together that they were in the ancestors. The thin lines crossing over A13 illustrate how homeologous recombination could generate this segmentally scrambled alignment from two precursors displaying fractionation bias.


