
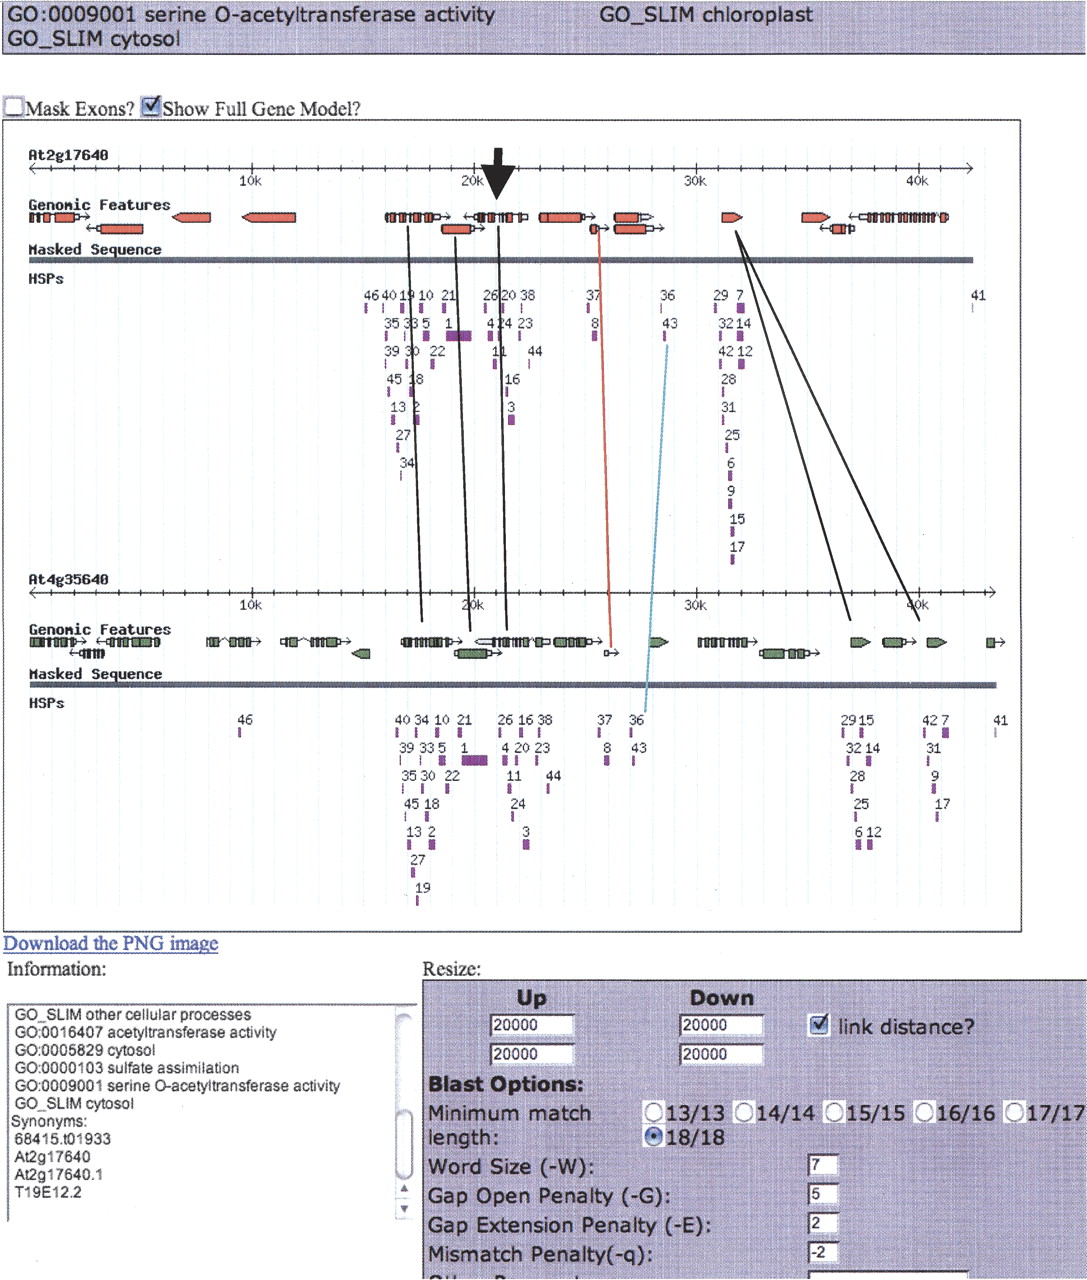
Partial screenshot of a “cluster” in our Viewer aligning 42–43 kb of the α-syntenous region of chromosomes 2 and 4 anchored on a serine o-acetyltransferase gene pair (bold arrowhead). The colored rectangles are bl2seq HSPs (high scoring pairs) found using standard settings and e-value cutoffs (Inada et al. 2003) noted in the settings box. Black lines connect known α-pairs of genes. The red line connects genes into a pair whose subject genes (exons) were not called by TIGR, and is now called an “Our Additional” (_oa) gene in Supplemental material 1, Column A. The turquoise line connects two groups of syntenous HSPs that required further research to explain; these were eventually called “conserved non-coding sequences” belonging to the gene pair to the left.


