
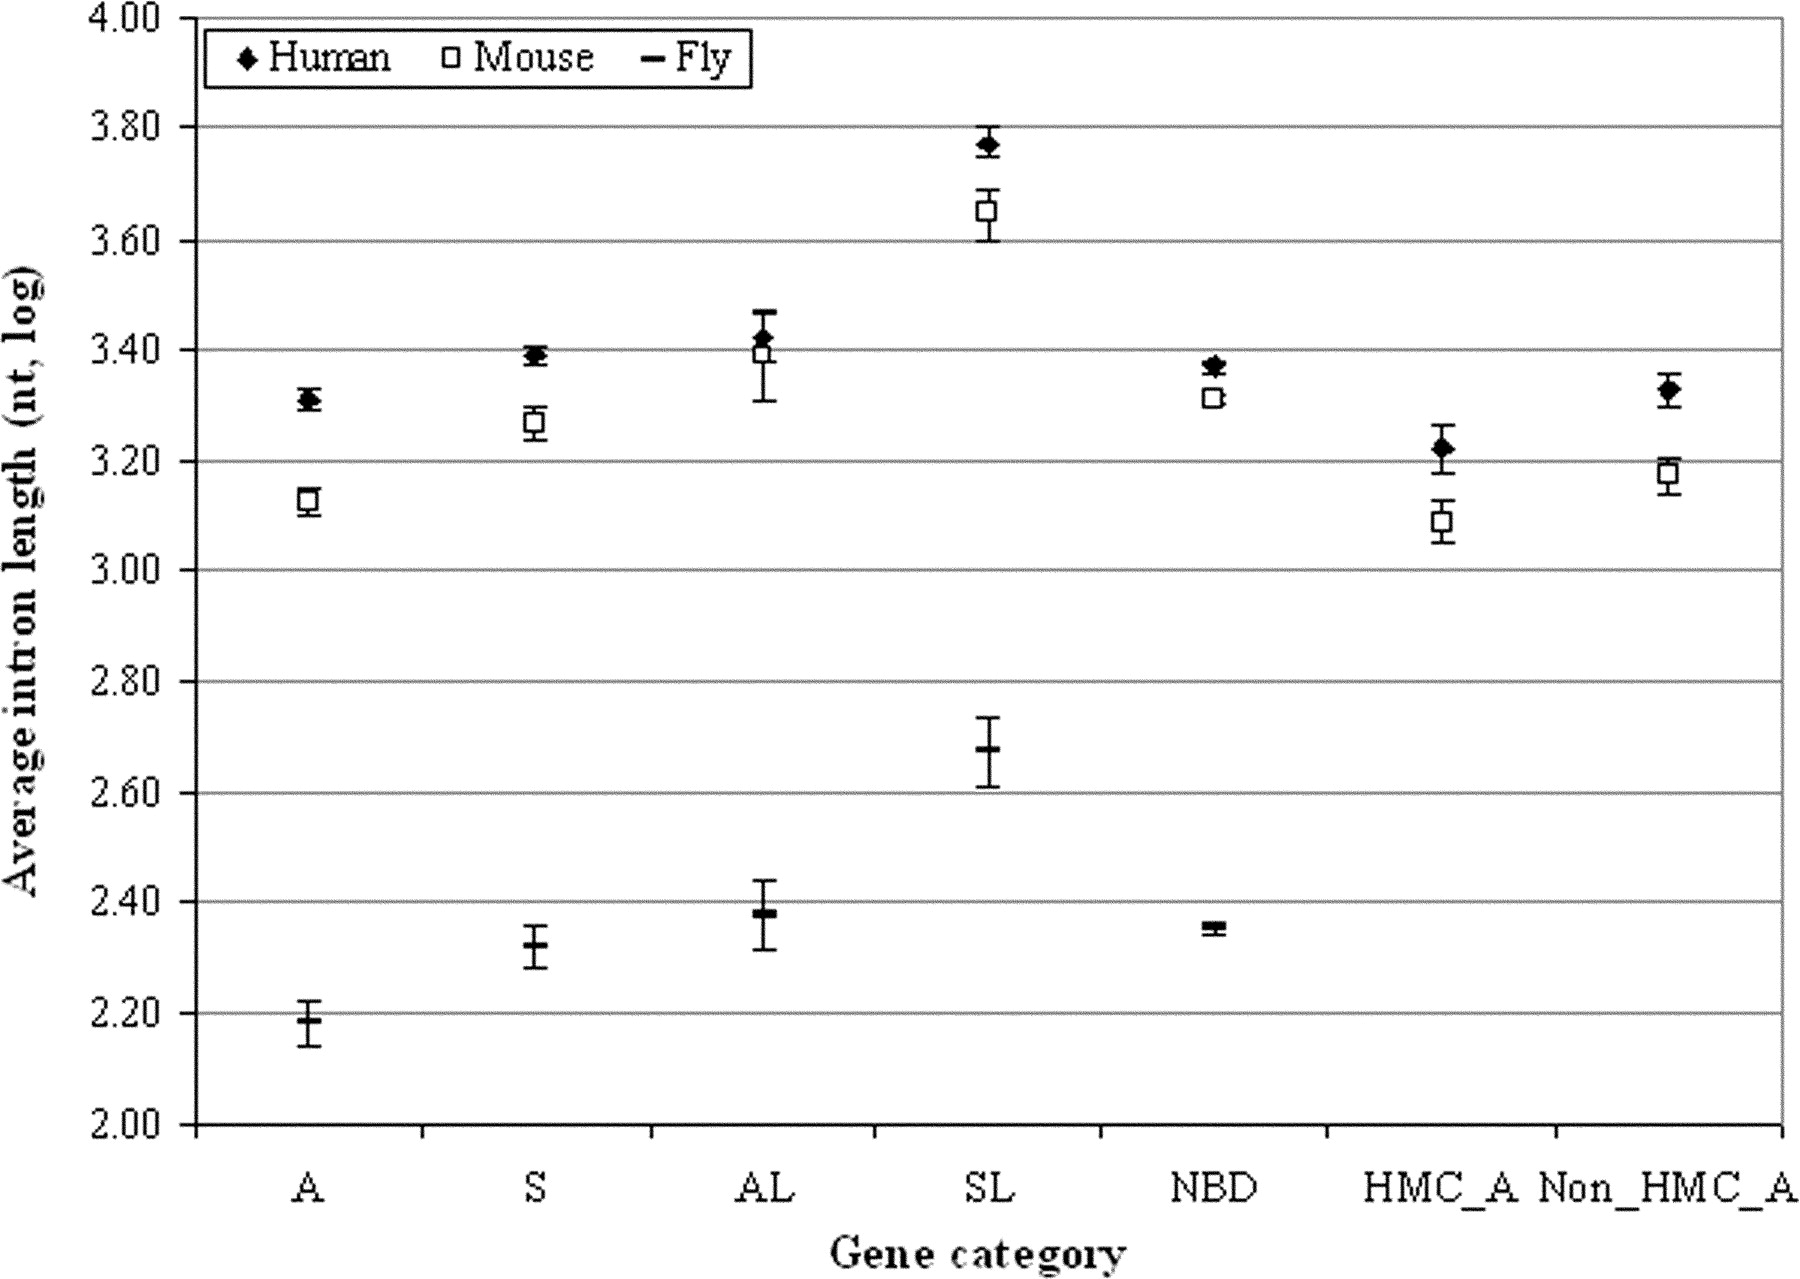
Comparison of the average intron lengths between antisense and other categories of genes in the human, mouse, and fly genomes. The mean values with their 95% confidence intervals of the logarithm (log) values of the intron lengths are shown. We use “independent samples t-test” to analyze the logarithm values of the intron lengths to determine significance (P-value) in difference of intron lengths between antisense and other genes. In all three genomes, antisense (A) genes have significantly shorter introns (P < 10−4 in the mouse and fly genomes; P < 0.01 in the human genome) than do any other category of genes (S, AL, SL, and NBD; see Methods for their classification). Notably, the difference of average intron lengths between antisense and other genes is even more significant in mice and flies than in humans. Moreover, as expected, in both human and mouse genomes, the average intron length of antisense genes in the 347 HM-conserved SA pairs (HMC_A) is significantly shorter than that of the remaining antisense genes (Non_HMC_A), and than those of the other categories of genes. Similar patterns were observed in the analysis of the total length of intron sequences (data not shown).


