
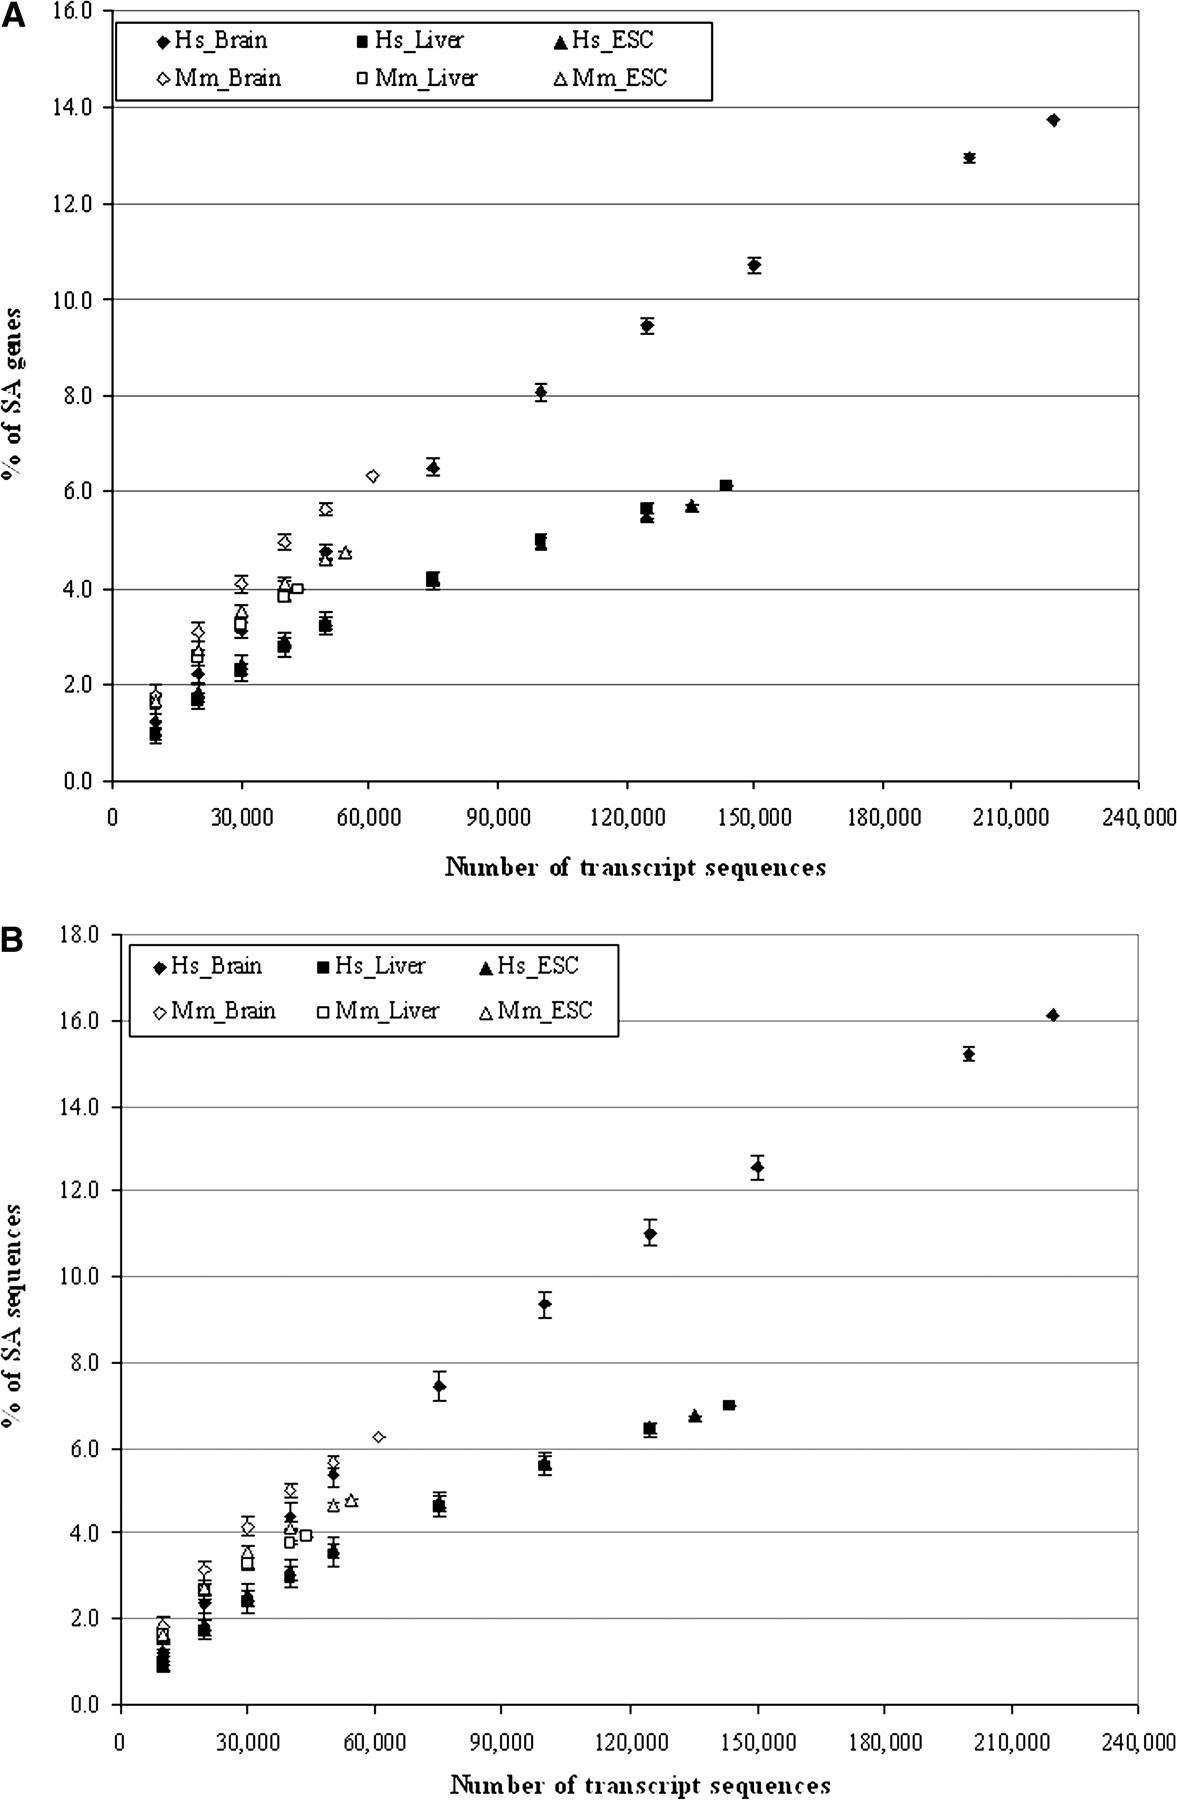
Relationship between the number of qualified transcripts and the estimated proportion of SA genes or sequences in human and mouse brain, liver, and embryonic stem cells. We randomly selected a set number of sequences from the whole set of qualified transcript sequences expressed in each type of tissue/cell in each genome and then estimated the SA proportion. For each number of transcripts, we repeated the analysis independently 1000 times. The mean values with their standard deviation (mean ± SD) are shown. (A) Relationship between the number of qualified transcripts and the estimated proportion of SA genes. (B) Relationship between the number of qualified transcripts and the estimated proportion of SA sequences. (Hs_) Human (Homo sapiens); (Mm_) mouse (Mus musculus); (ESC) embryonic stem cells.


