
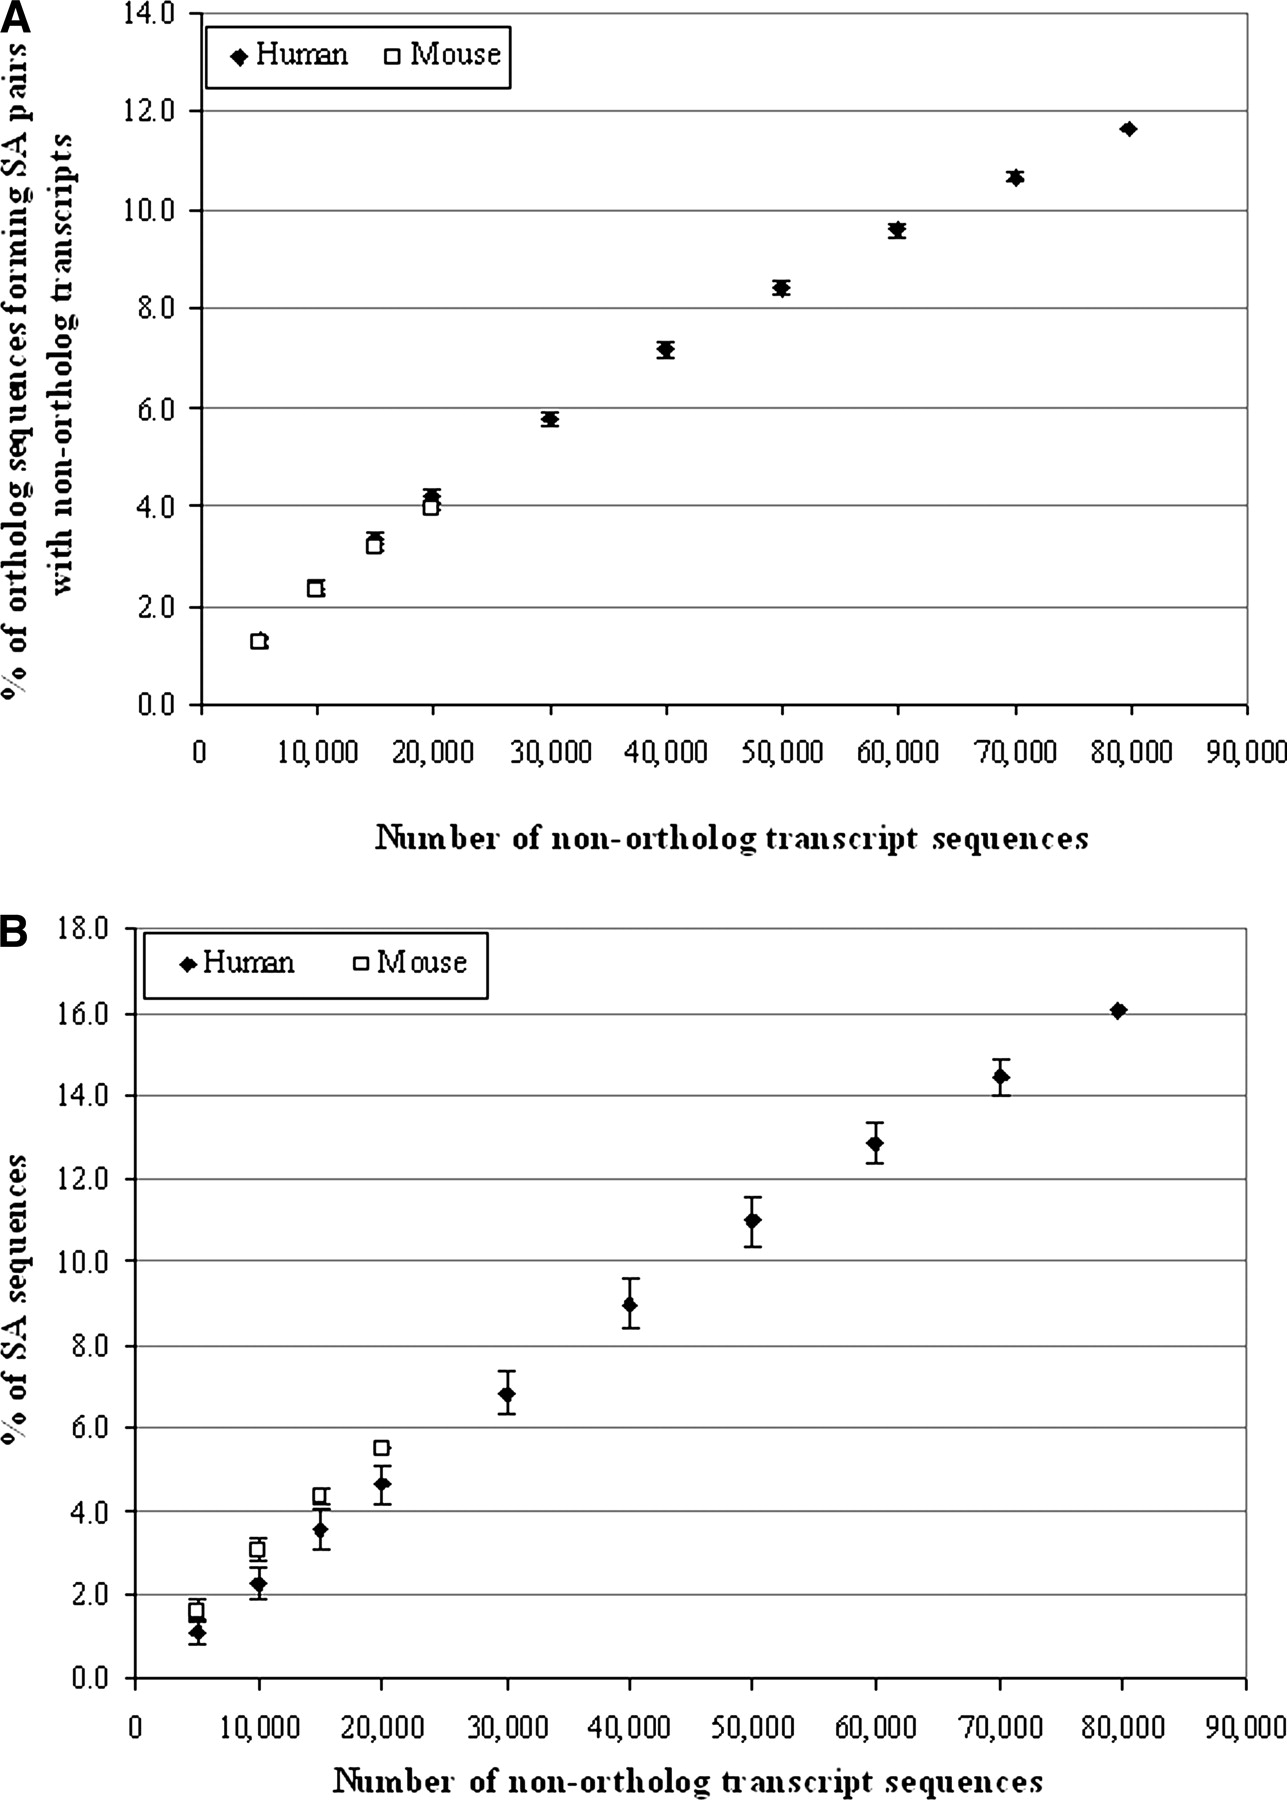
Relationship between the number of nonortholog transcripts and the percentage of human–mouse ortholog transcripts that form SA pairs with nonortholog transcripts, or between the number of nonortholog transcripts and the proportion of SA transcripts within the selected nonortholog transcripts in humans and mice, respectively. (A) We randomly selected a set number of sequences from the whole qualified nonortholog transcript sequence data set for each genome, and then combined them with the 11,931 one-to-one human–mouse ortholog transcripts and determined the SA pairs formed between ortholog and nonortholog transcripts. Thus, the percentages of the 11,931 one-to-one human–mouse ortholog transcripts that form SA pairs with nonortholog transcripts were determined in each species. (B) We randomly selected a set number of qualified nonortholog transcript sequences and determined the SA pairs formed between nonortholog transcripts. Thus, the percentages of SA transcripts within the selected nonortholog transcripts were determined in each species. For each point, we repeated the analysis independently 1000 times. The mean values with their standard deviation (mean ± SD) are shown.


