
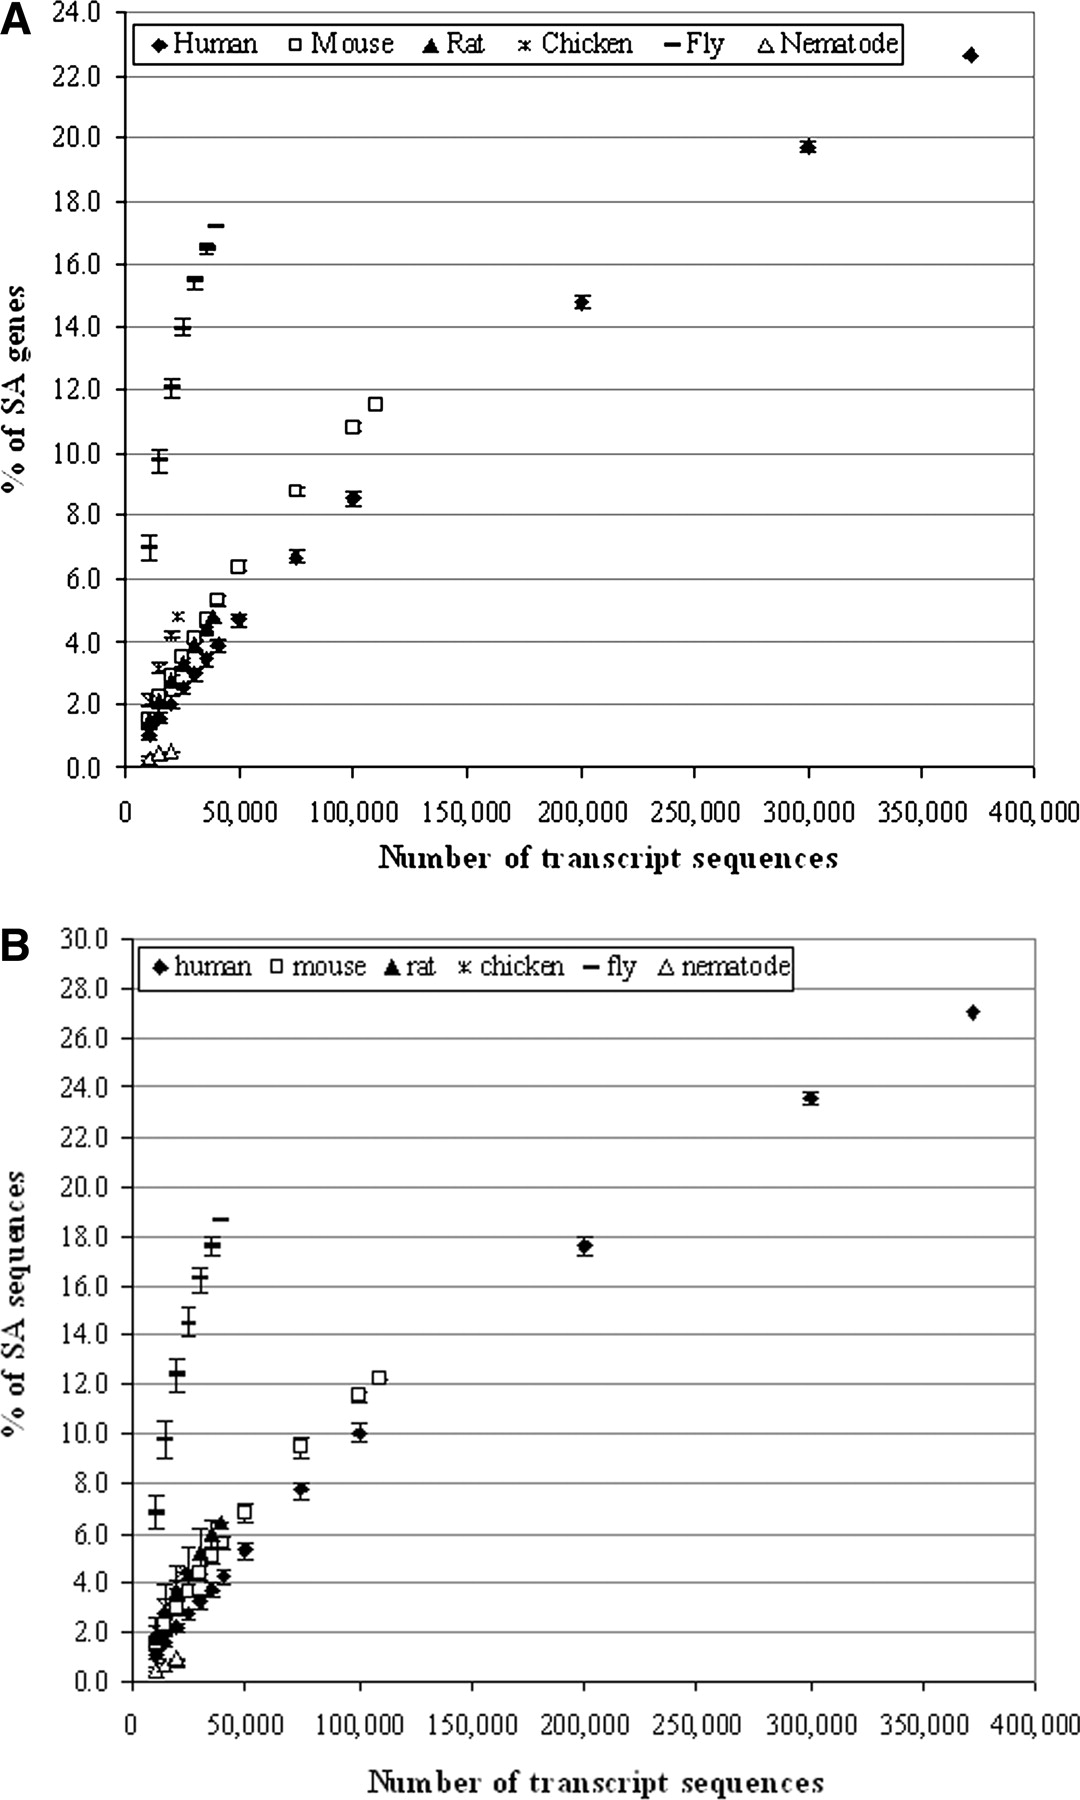
Relationship between the number of qualified transcripts and the estimated proportion of SA genes or sequences. We randomly selected a set number of sequences from the whole qualified transcript sequence data set for each genome (see Supplemental Table 1) and then followed the same procedure (see Methods) to estimate the SA gene/sequence proportion. For each number of transcripts, we repeated the analysis independently 1000 times. The mean values with their standard deviation (mean ± SD) are shown. “% of SA genes/sequences” refers to the proportion of genes/sequences involved in putative antisense transcription (i.e., forming putative SA pairs) in a given gene/sequence data set. (A) Relationship between the number of qualified transcripts and the estimated proportion of SA genes. (B) Relationship between the number of qualified transcripts and the estimated proportion of SA sequences.


