
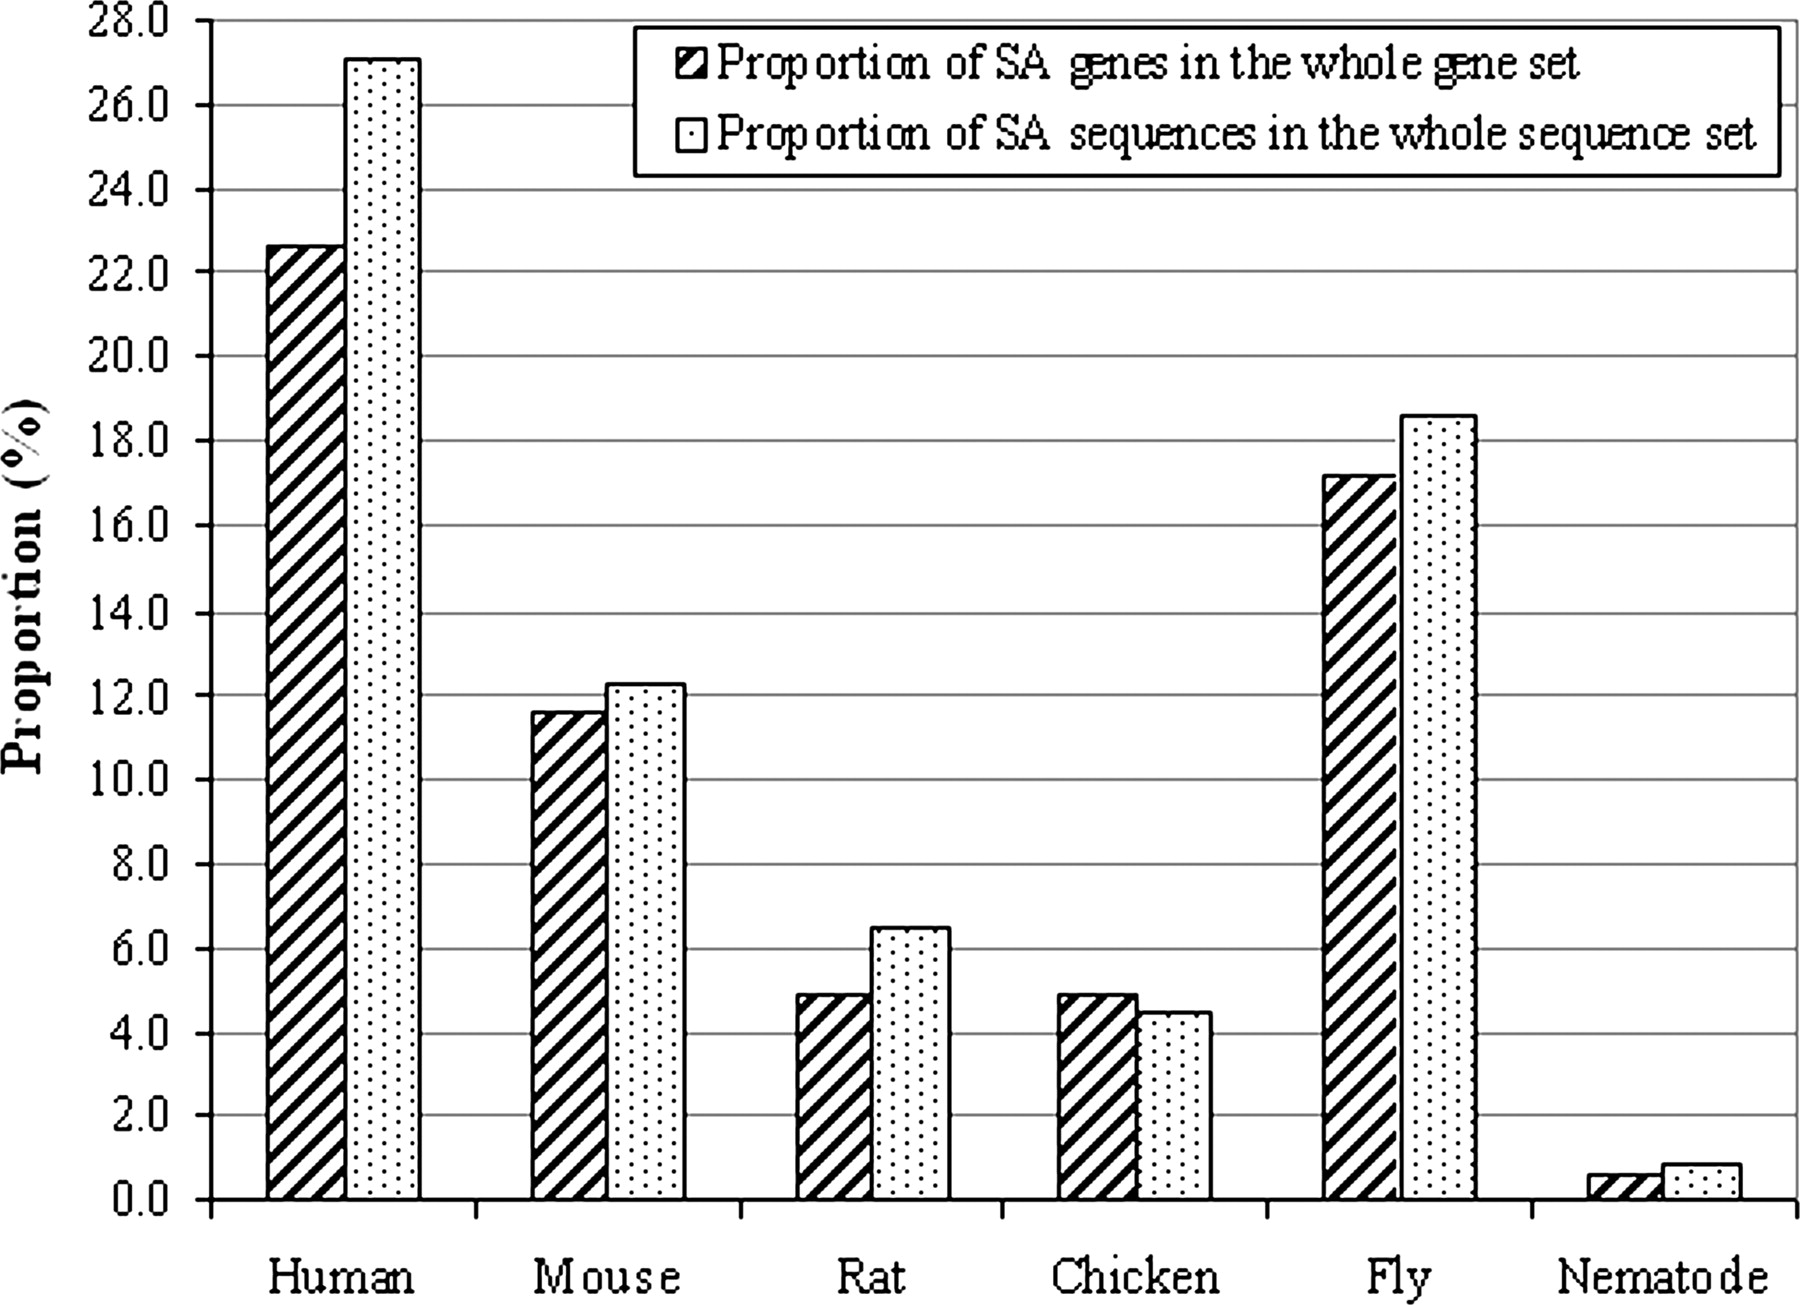
Figure 1.
Proportion of sense–antisense (SA) genes or sequences in the whole gene or sequence data set in each genome. One sequence represents one (qualified) transcript sequence, while one gene may contain several (qualified) transcript sequences. For example, as shown in Table 1, a total of 100,444 human SA transcript sequences belong to 6194 SA genes (i.e., ∼16 transcript sequences per sense/antisense gene). Humans have the highest proportion of SA genes and sequences, while nematodes have the lowest proportion. See Table 1 for more details.


