
Classification of genes for localization patterns highlighted the distinct association patterns of ALY, PTBP1, and CSTF2 across individual genes
Click on table to view larger version.
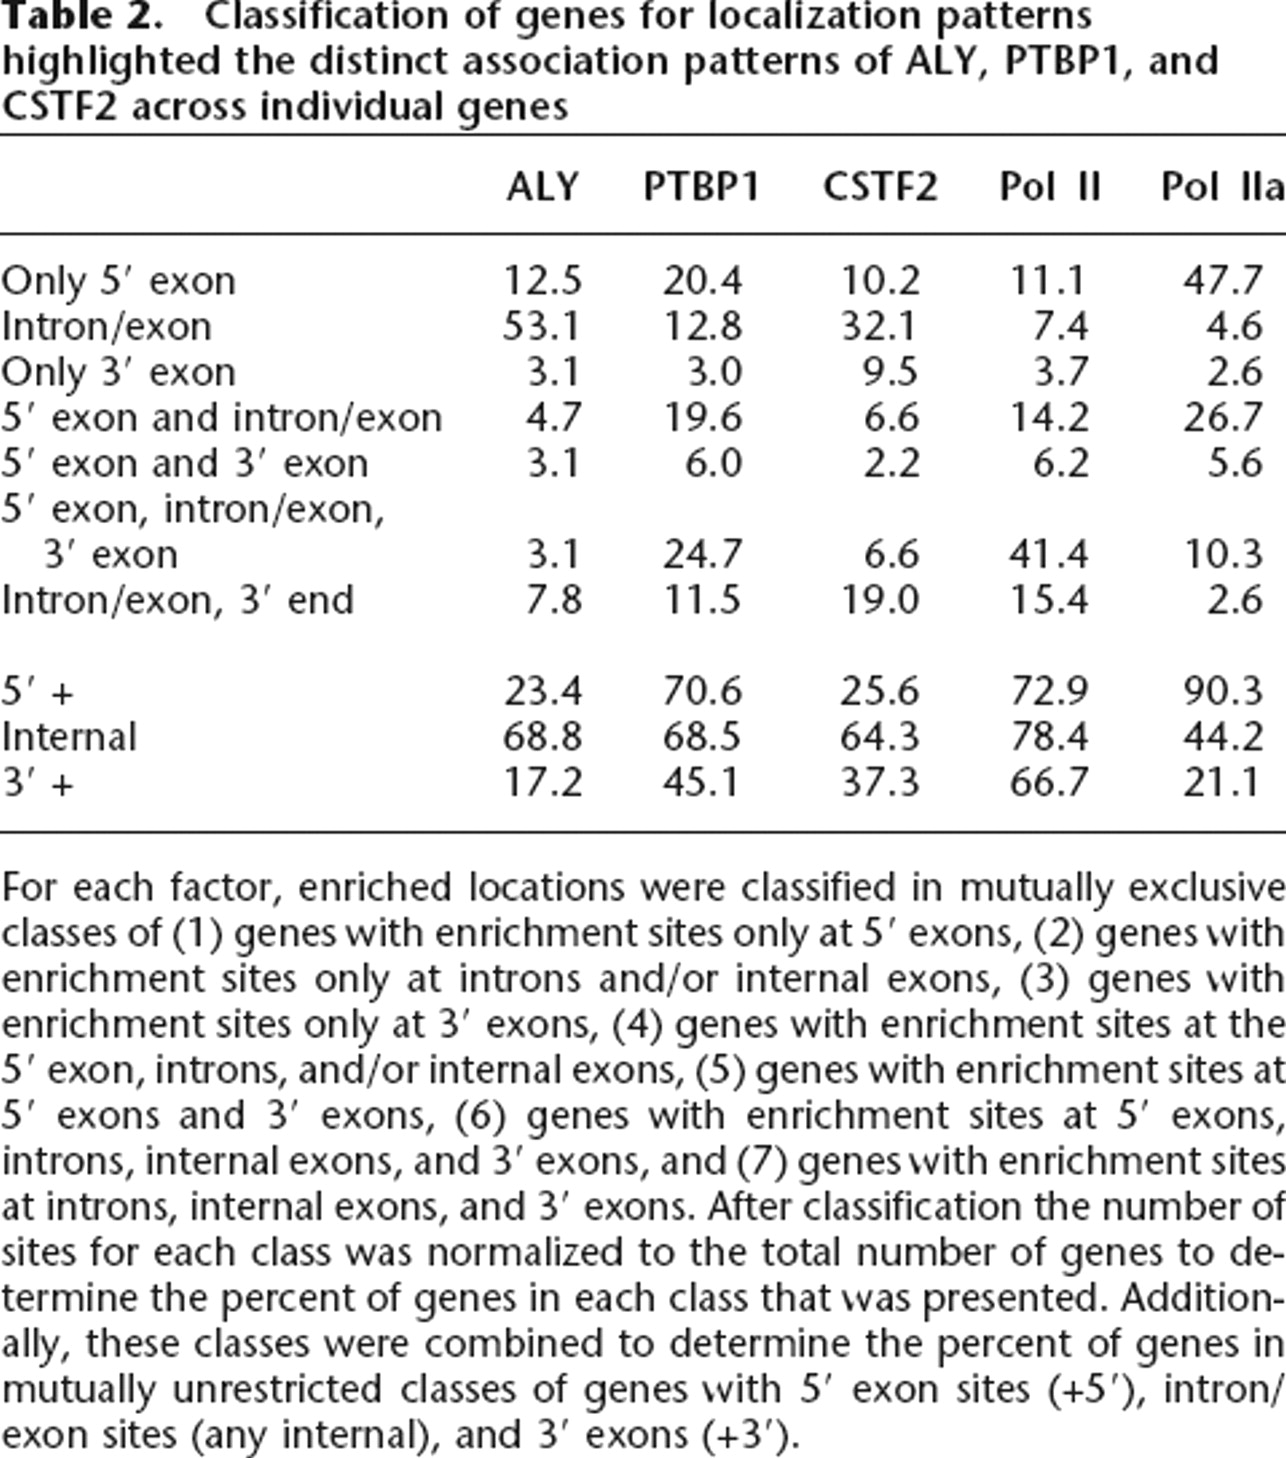
For each factor, enriched locations were classified in mutually exclusive classes of (1) genes with enrichment sites only at 5′ exons, (2) genes with enrichment sites only at introns and/or internal exons, (3) genes with enrichment sites only at 3′ exons, (4) genes with enrichment sites at the 5′ exon, introns, and/or internal exons, (5) genes with enrichment sites at 5′ exons and 3′ exons, (6) genes with enrichment sites at 5′ exons, introns, internal exons, and 3′ exons, and (7) genes with enrichment sites at introns, internal exons, and 3′ exons. After classification the number of sites for each class was normalized to the total number of genes to determine the percent of genes in each class that was presented. Additionally, these classes were combined to determine the percent of genes in mutually unrestricted classes of genes with 5′ exon sites (+5′), intron/exon sites (any internal), and 3′ exons (+3′).


