
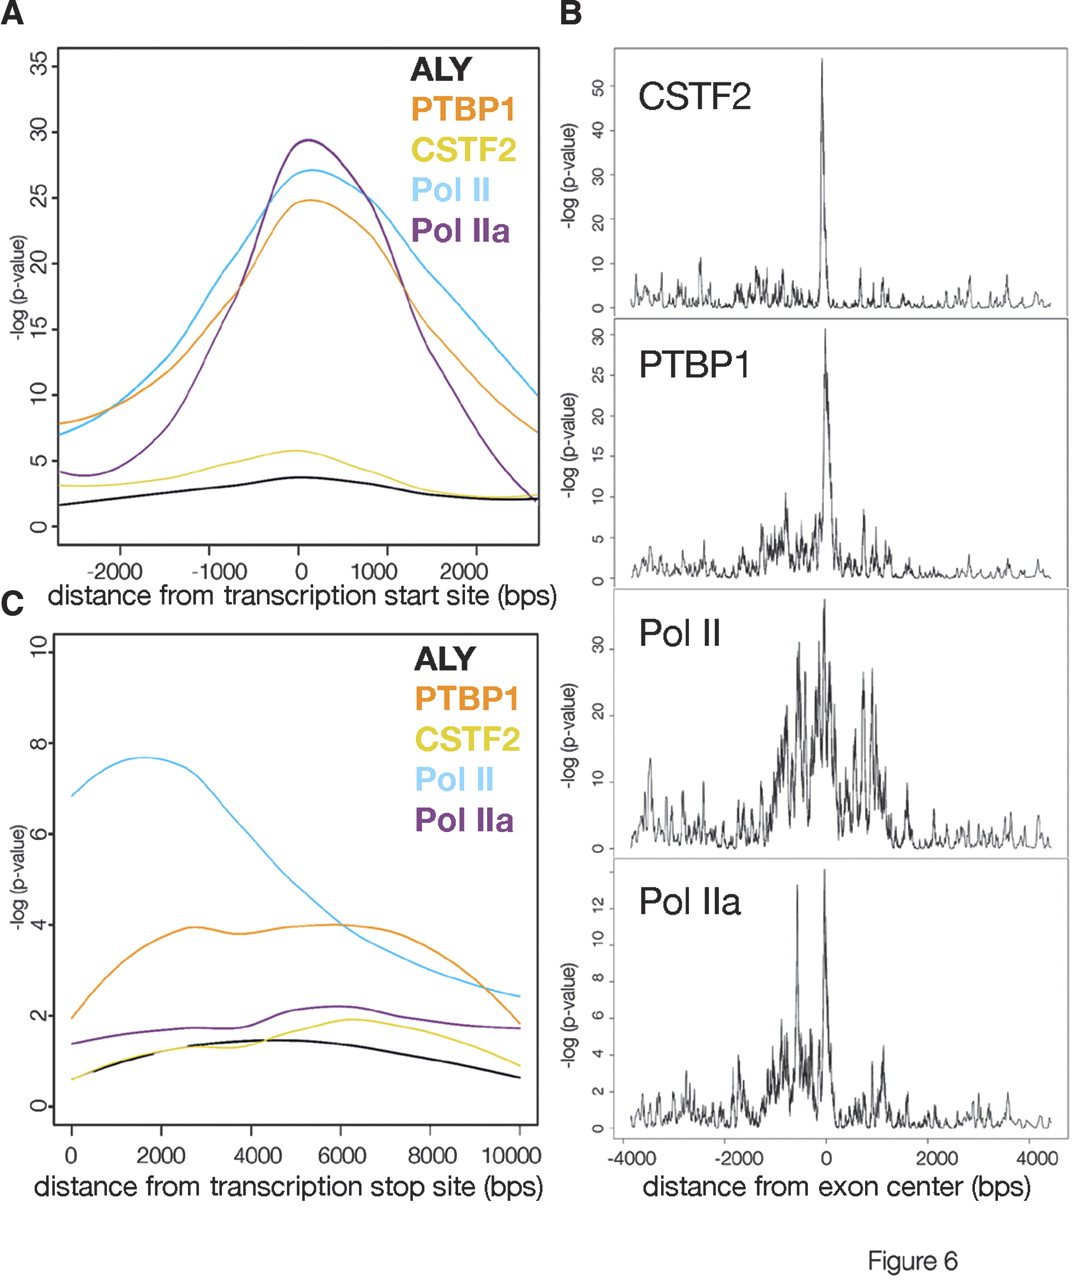
Figure 6.
Location analysis of strongest enrichment at particular classes of sites shows factor-specific association patterns. (A) 5′ exon signal analysis of each factor examined. The P-value patterns at the top 10% sites for 5′ and 3′ exons were smoothed and plotted as curves to show signal patterns relative to the beginning or end of genes. (B) For each factor, enrichment around internal exons was averaged but not smoothed to highlight minor peaks up and down stream of exons. (C) Location analysis performed as in A for 3′ exon signal of each factor examined.


