
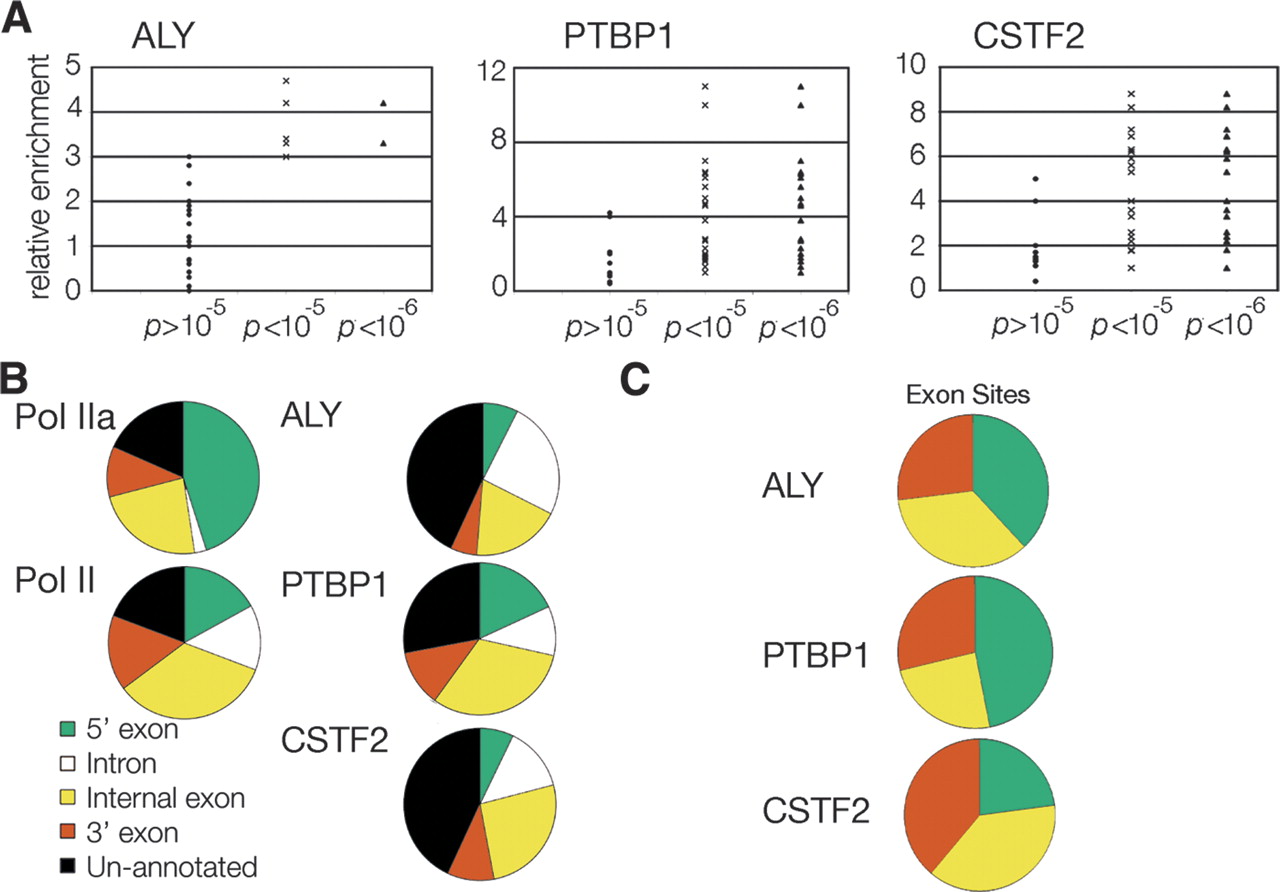
Analysis of array data showed P < 10−6 were significant and annotation of these sites revealed unique patterns and biases. (A) PCR validation of array data, performed with PCR assay used in Figure Figure 1. Each point in the scatter plots represents a PCR validation. (B) RefSeq site annotation of sites enriched for RNA polymerase II, ALY, PTBP1, and CSTF2. Sites were annotated as being 5′ exons, introns, internal exons, 3′ exons, and unannotated as described in Methods. Numbers for each annotation are in Table 1. (C) Exon biases of RNA binding proteins. The percent of each protein’s exons that are 5′, 3′, or internal (by default) was determined and plotted on a pie chart to illustrate factor biases.


