
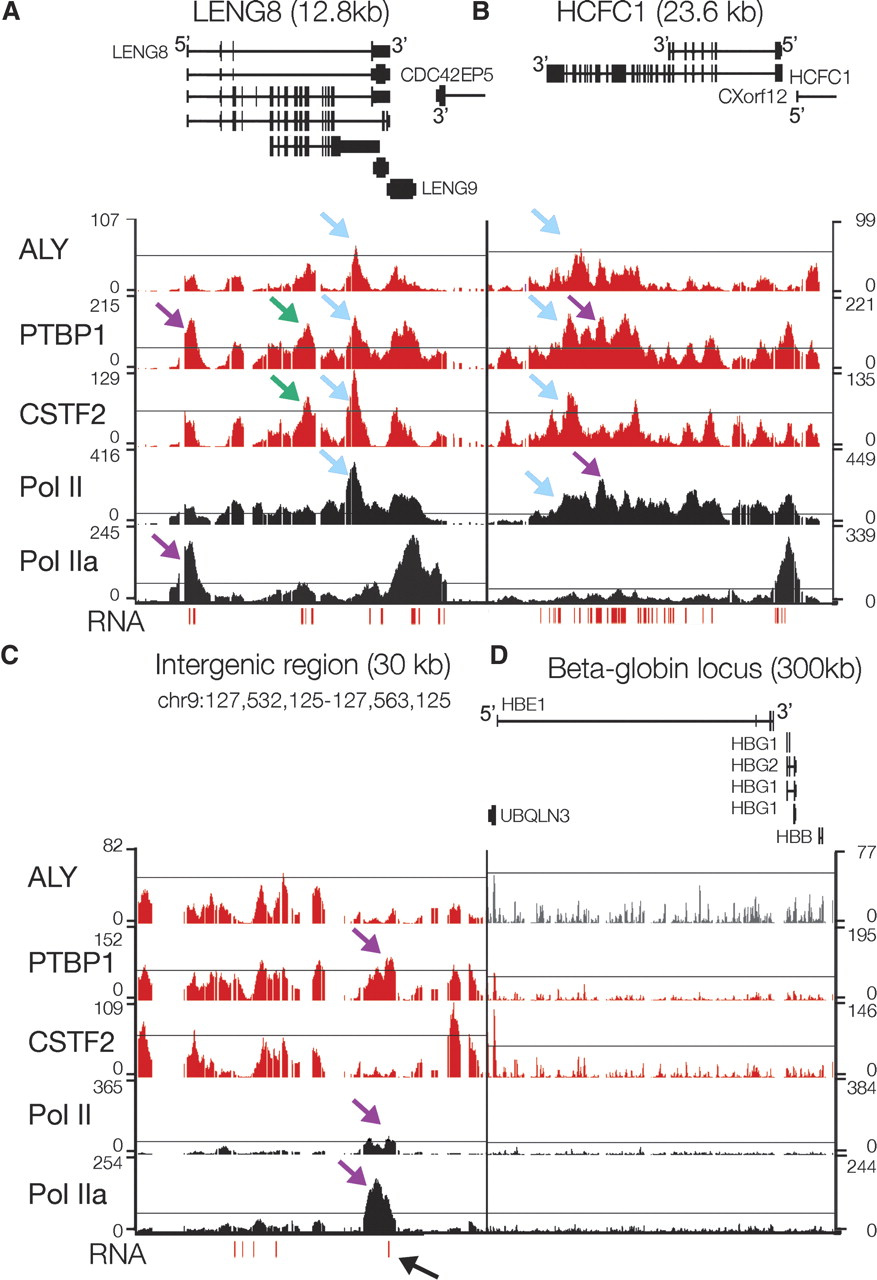
High resolution mapping of ALY, PTBP1, CSTF2, Pol II, Pol IIa, and RNA shows accumulation at distinct sites. Pol II sites were determined using an antibody, 4H8, that recognizes both phosphorylated and unphosphorylated RNA polymerase II. Pol IIa sites were determined using an antibody, 8WG16, which recognizes primarily unphosphorylated RNA polymerase II. RNA was reverse-transcribed with random primers and the resulting cDNA was probed on the tiled ENCODE arrays. Representative plots of –10 log (P-value) across LENG8 (A), HCFC1 (B), an intergenic region (C), and the β-globin locus (D). Schematics of the genes from the known genes database are shown and labeled at the 5′ end to indicate the direction of transcription of each gene. The thin line in each plot marks a P-value of 10−6 except for ALY, where it marks a P-value of 10−5. Blue arrows highlight sites where RNA binding proteins were similar to other RNA binding proteins as well as RNA Pol II, purple arrows highlight sites where RNA binding proteins were different than one another, green arrows highlight sites where there was RNA binding protein enrichment in the absence of significant RNA Pol II accumulation, and the black arrow highlights an unannotated loci where PTBP1, RNA Pol II, and RNA signal were observed.


