
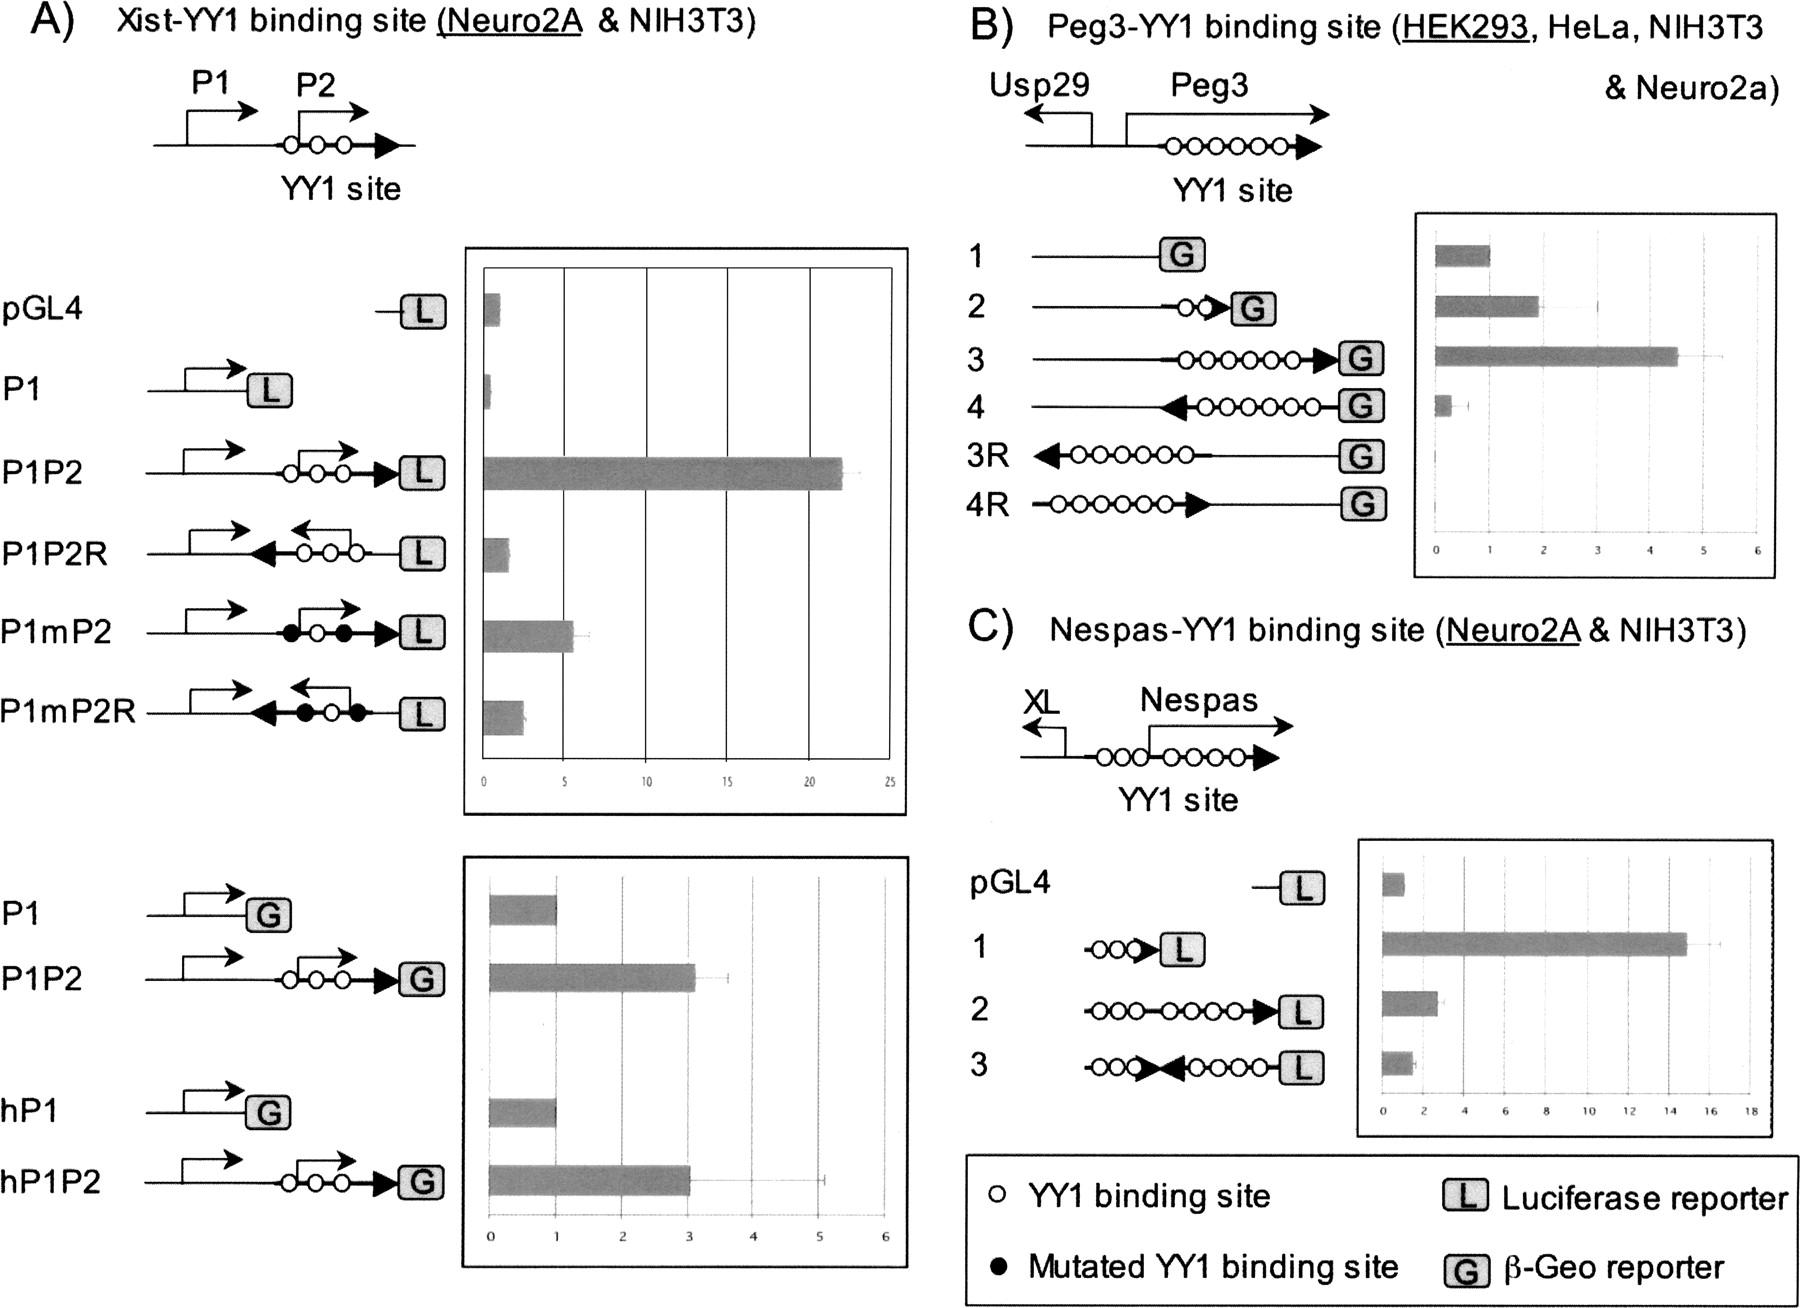
Transcriptional activity of the clustered YY1 binding sites. The transcriptional involvement of each clustered YY1 binding site was tested together with its endogenous promoter using pGL4 and/or IRES-β-Geo promoterless vector systems. (A) Transcriptional activity of YY1 binding sites of mouse and human Xist. The schematic diagram represents the genomic layout of two promoters with three YY1 binding sites of mouse Xist. Five constructs with one internal control (pGL4) were used for the analyses of the two promoters of mouse Xist, P1 and P2. The values shown in the graph on the right represent the averaged fold difference with standard deviation compared to that of the internal control. Each construct was analyzed more than three times using different cell lines shown inside a parenthesis. Because the overall patterns of data were similar among different cell lines, the graph shows only one representative data set from one of these cell lines, the name of which is underlined. The four constructs on the bottom represent the constructs of mouse and human Xist using another vector system, IRES-β-Geo. Two other YY1 binding sites were also analyzed in a similar way: the YY1 binding sites of mouse Peg3 (B) and mouse Nespas (C). In the case of constructs derived from IRES-β-Geo, the empty control vector does not yield any activity at all, and thus the vector construct containing each promoter without YY1 binding sites was used as an internal control. According to the results of Student’s t-test, most data points meet the statistical significance (P < 0.05) except a few constructs in each given cell line, as shown in construct 2 of Peg3 in HEK293 and construct hP1P2 of hXist in Neuro2a. However, the data of these constructs in other cell lines are consistent with the overall patterns shown above with much higher statistical significance.


