
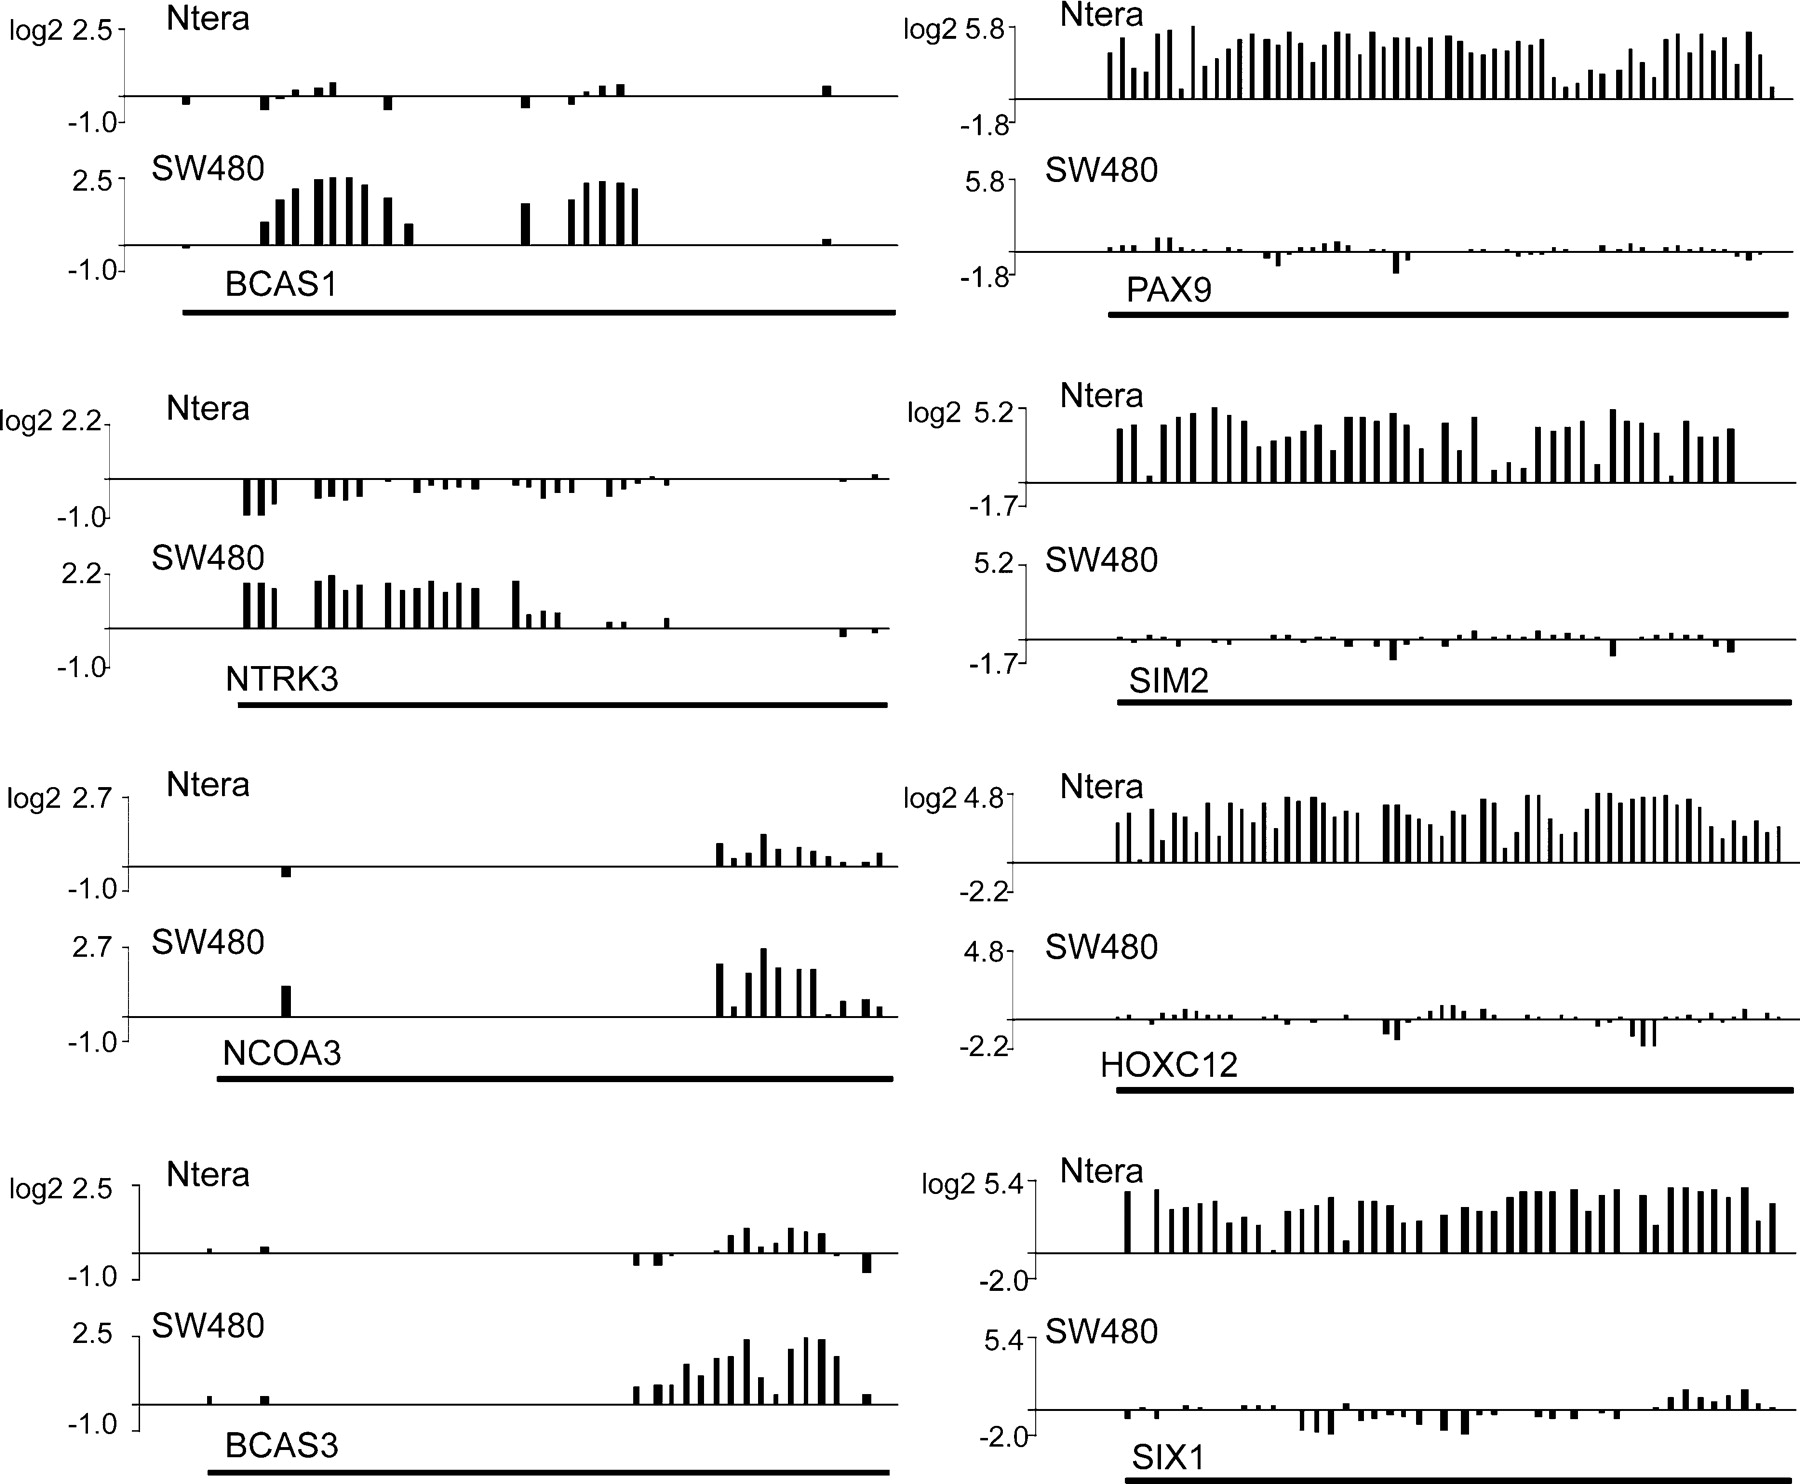
Figure 3.
Analysis of SUZ12 target promoters. Shown are the SUZ12 binding patterns on four top ranked SUZ12 target promoters from SW480 (left panel) and Ntera2 (right panel) cells. The black bar indicates the 5-kb region of each promoter that is tiled by the oligomer probes.


