
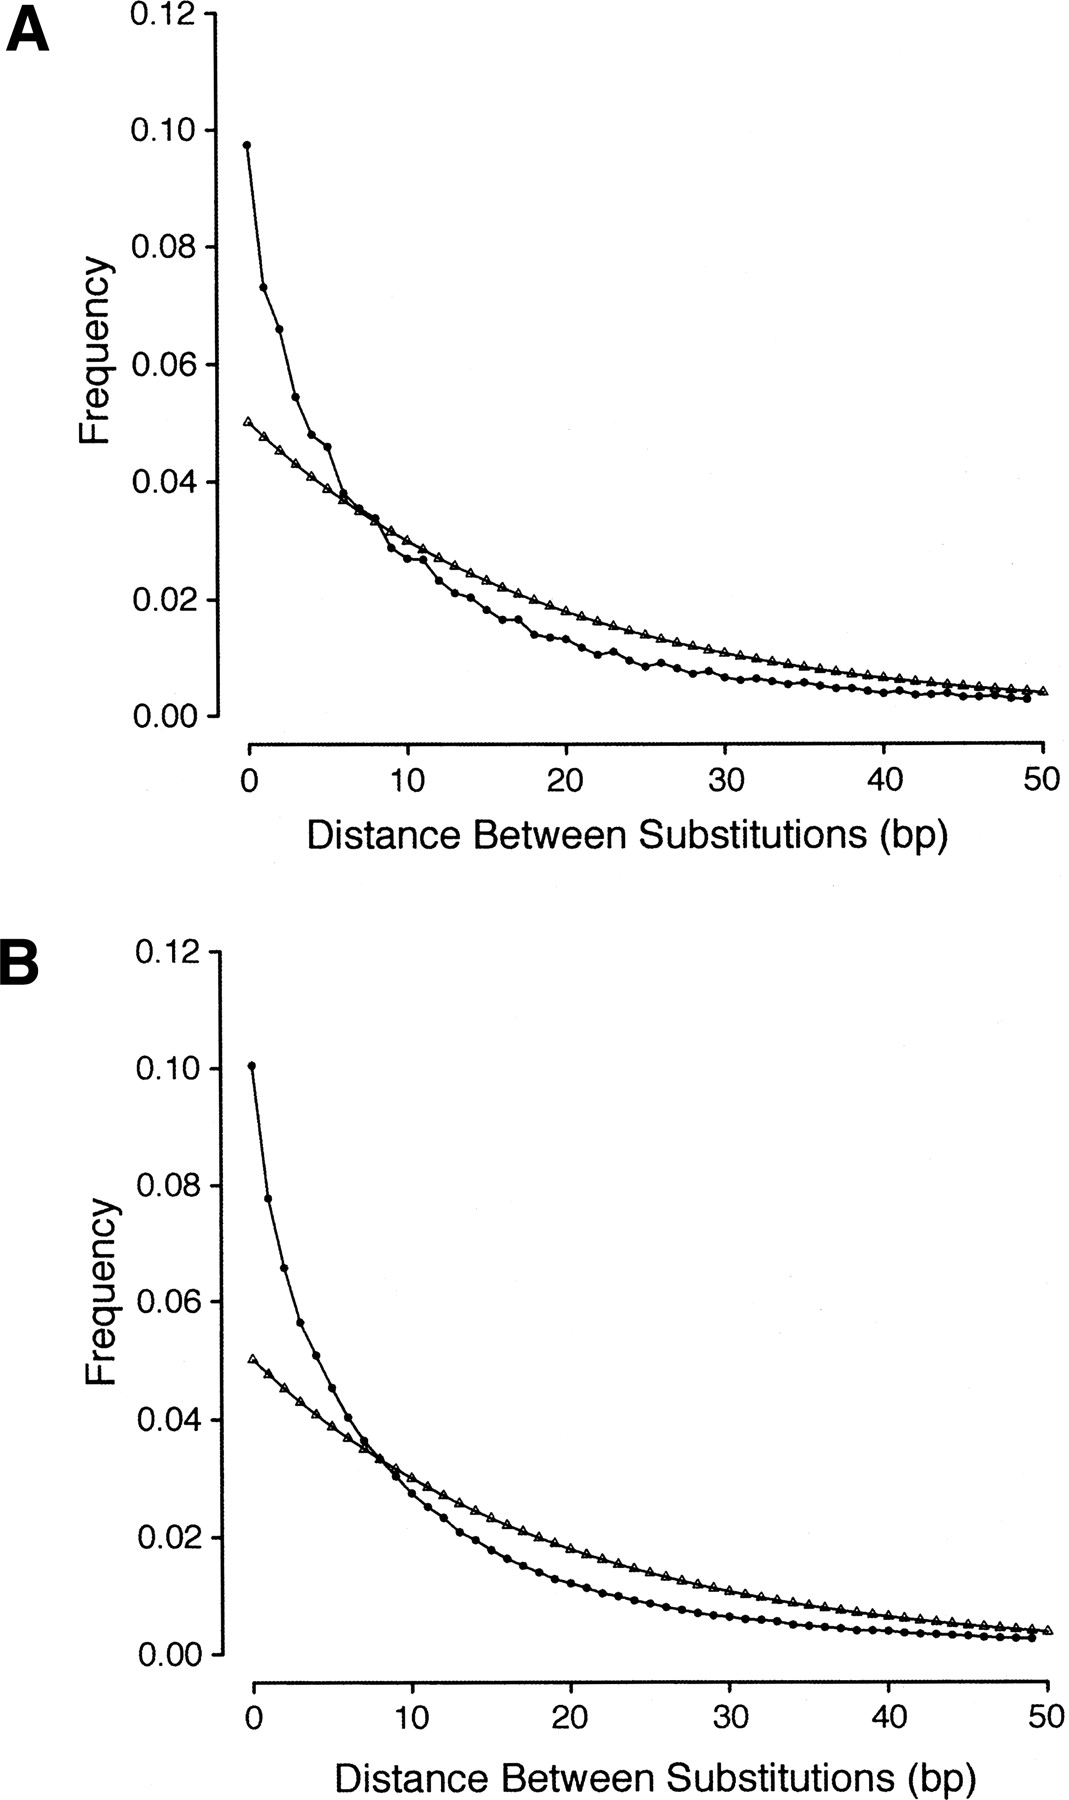
Figure 5.
Observed (circles) and predicted (triangles) frequency distributions of distances between substitutions for (A) introns and (B) intergenic sequences longer than 1000 bp. The predicted frequency distribution assumes that the distances between substitutions are geometrically distributed and that the mean distance between substitutions is equal to that observed in the real data.


