
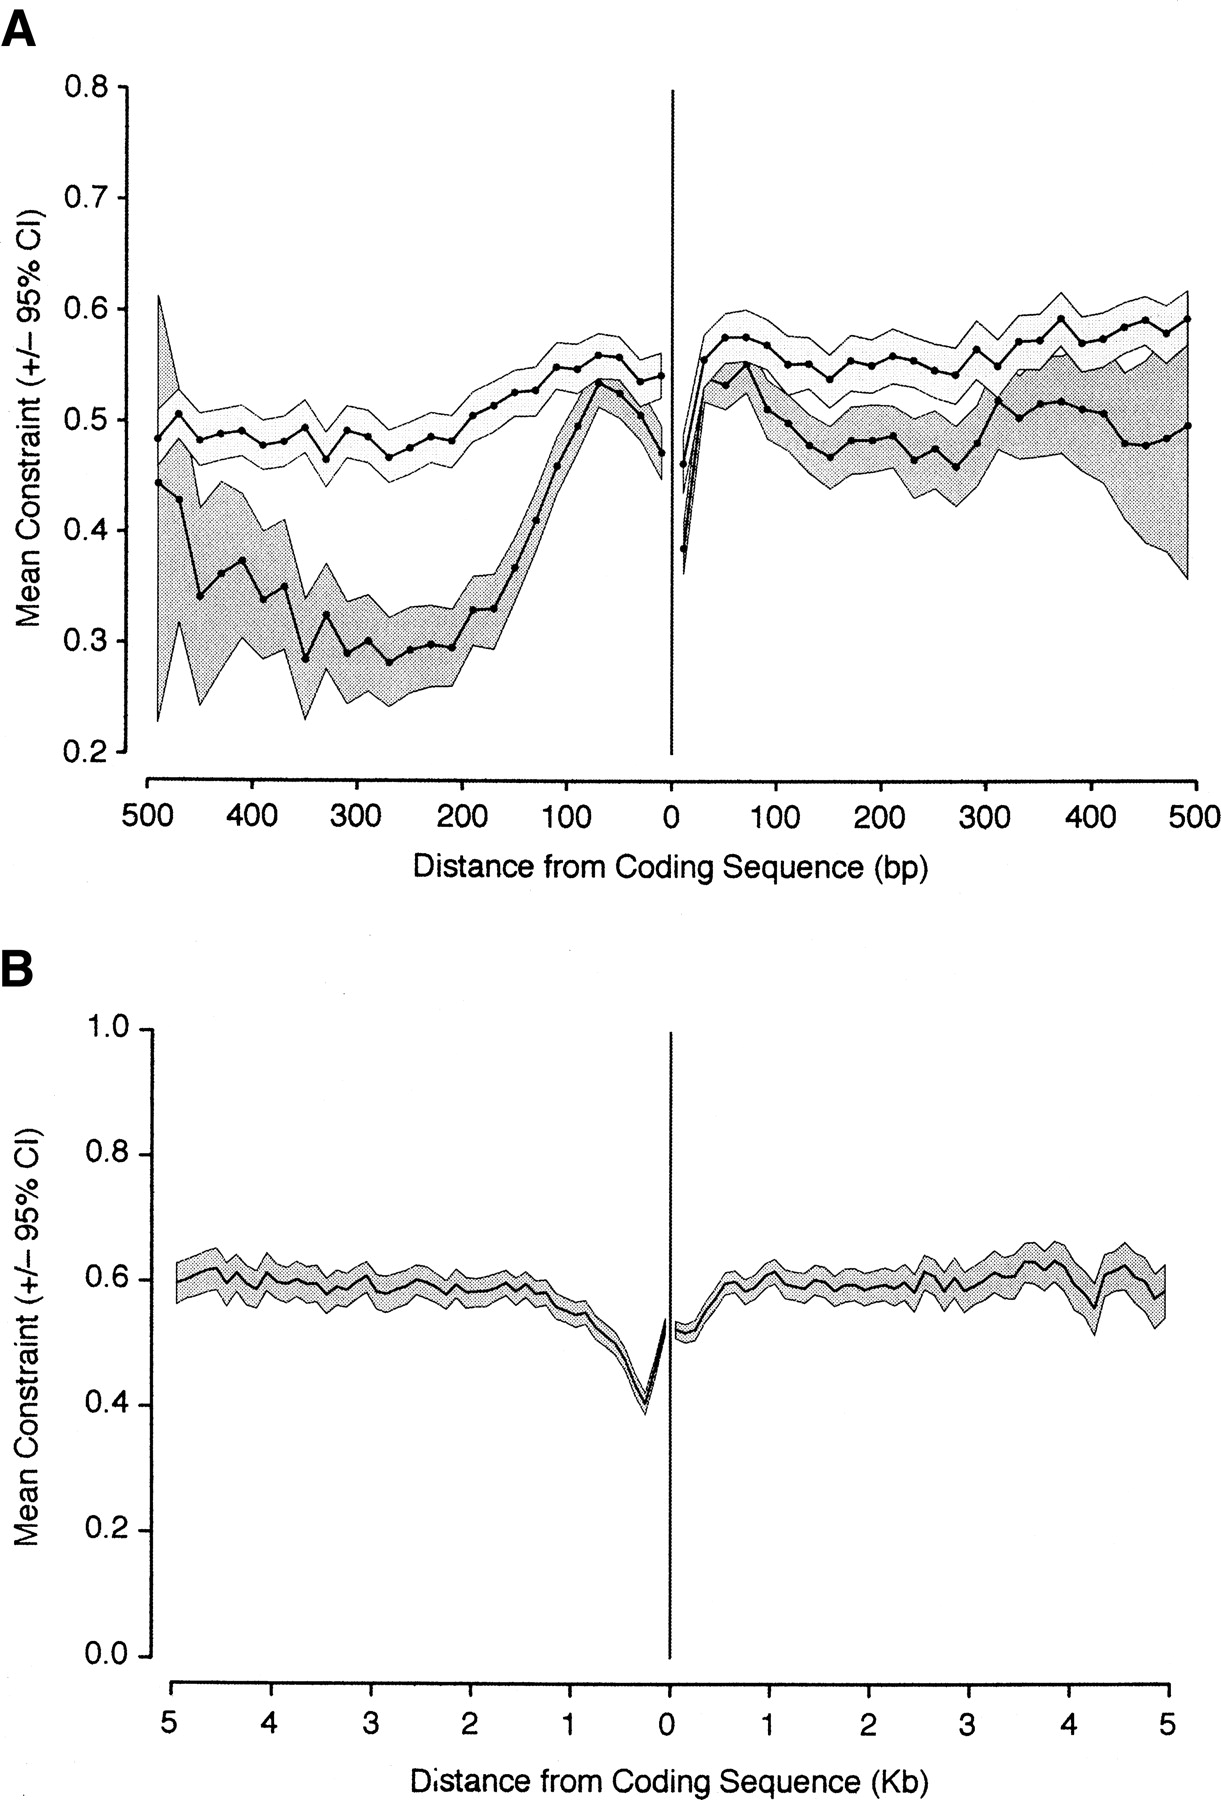
Mean constraint (±95% confidence interval as a gray box) in intergenic sequences flanking coding sequences, plotted as a function of distance from the coding sequence boundary. Constraint in 5′ sequences is shown on the left, and constraint in 3′ sequences is shown on the right. (A) Mean constraint in the first 500 bp flanking a coding sequence plotted for two arbitrary size classes of intergenic DNA; short (≤500 bp; dark gray) and long (>500 bp; light gray). (B) Mean constraint for 5 kb of flanking sequence in all lengths of intergenic sequence. Mean constraint was calculated for 20-bp nonoverlapping blocks, and the confidence interval for each block was obtained by bootstrapping 1000 times by genomic section.


