
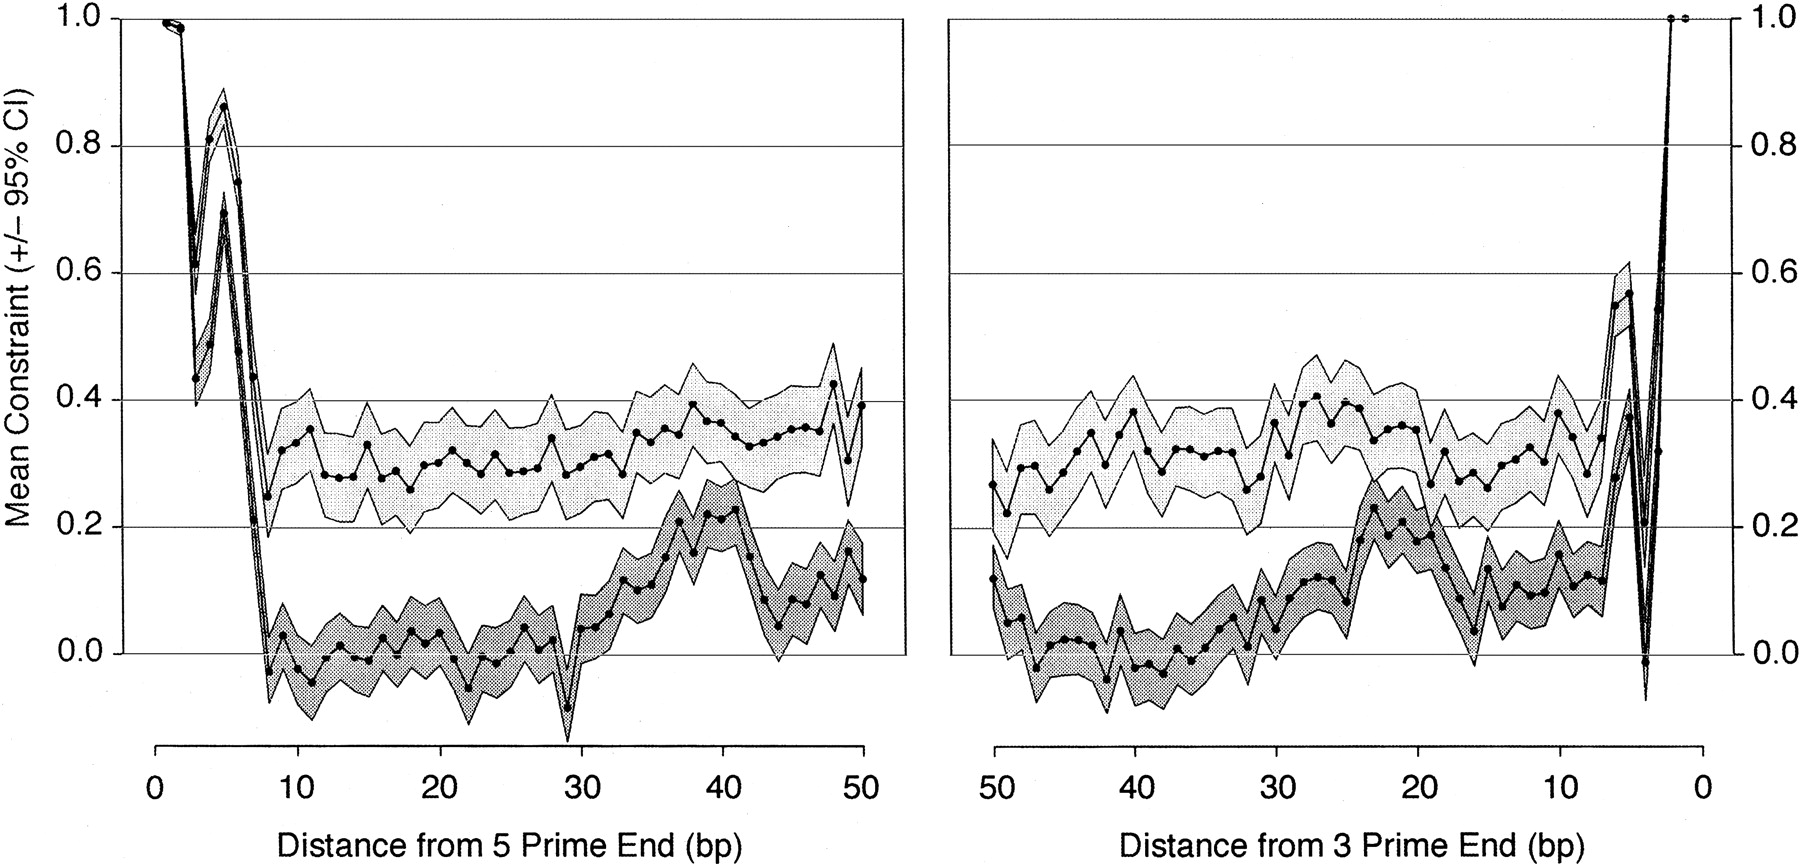
Figure 3.
Mean constraint (±95% confidence interval as a gray box) for short (dark gray) and long (light gray) introns, plotted as a function of distance from the 5′- and 3′-ends of the intron. Confidence intervals were obtained by bootstrapping 1000 times by genomic section.


