
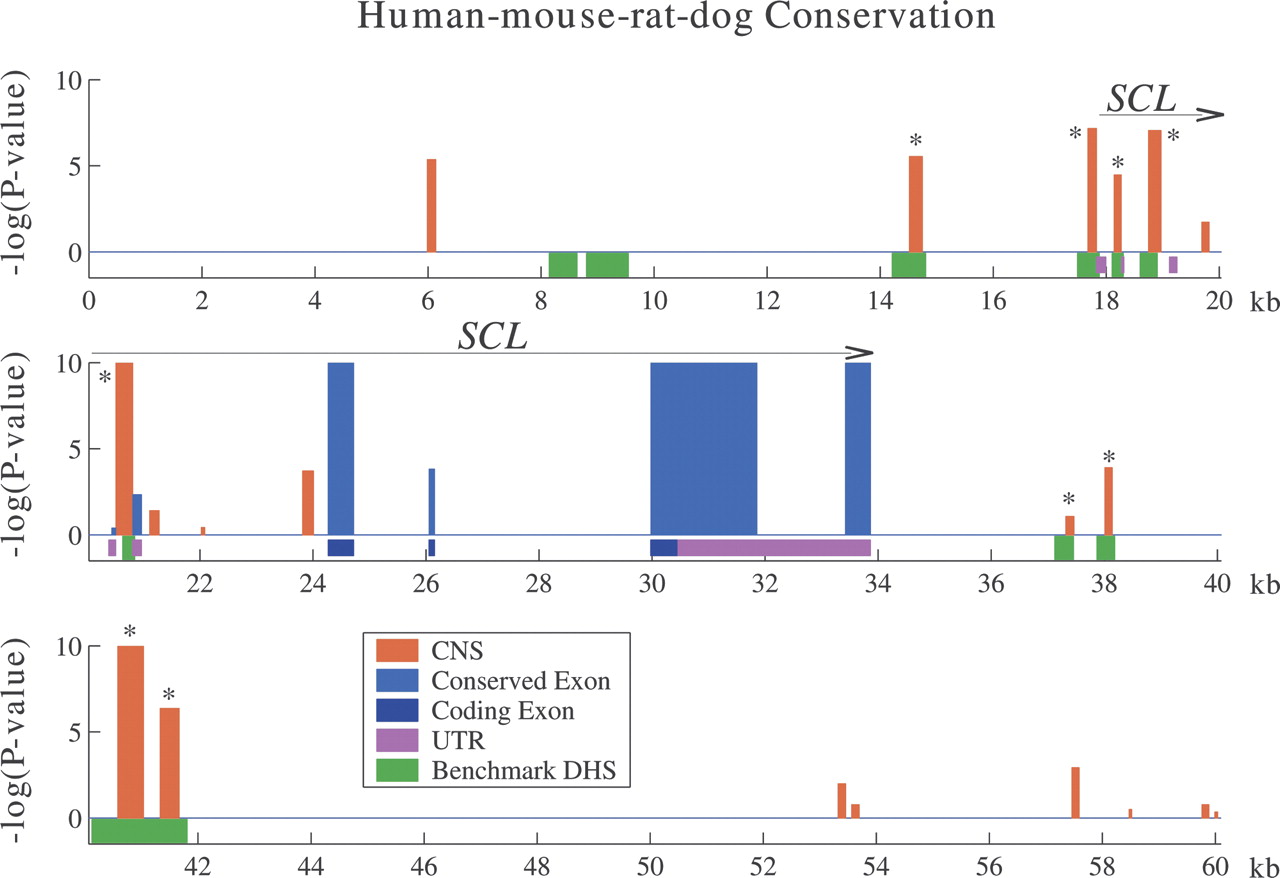
Figure 5.
SCL locus: Benchmarking eutherian sequence comparison against empirical data. The displayed 60-kb genomic region contains the SCL gene and its flanking intergenic regions. Human–mouse–rat–dog CNSs (red) and exonic (blue) conserved regions identified by Gumby (P-value ≤ 0.5) are shown as vertical bars. The nine CNSs marked with asterisks identify 8/10 benchmark sequence elements with empirical evidence of cis-regulatory function (green rectangles). Additionally, there are 11 new predictions at this P-value threshold.


