
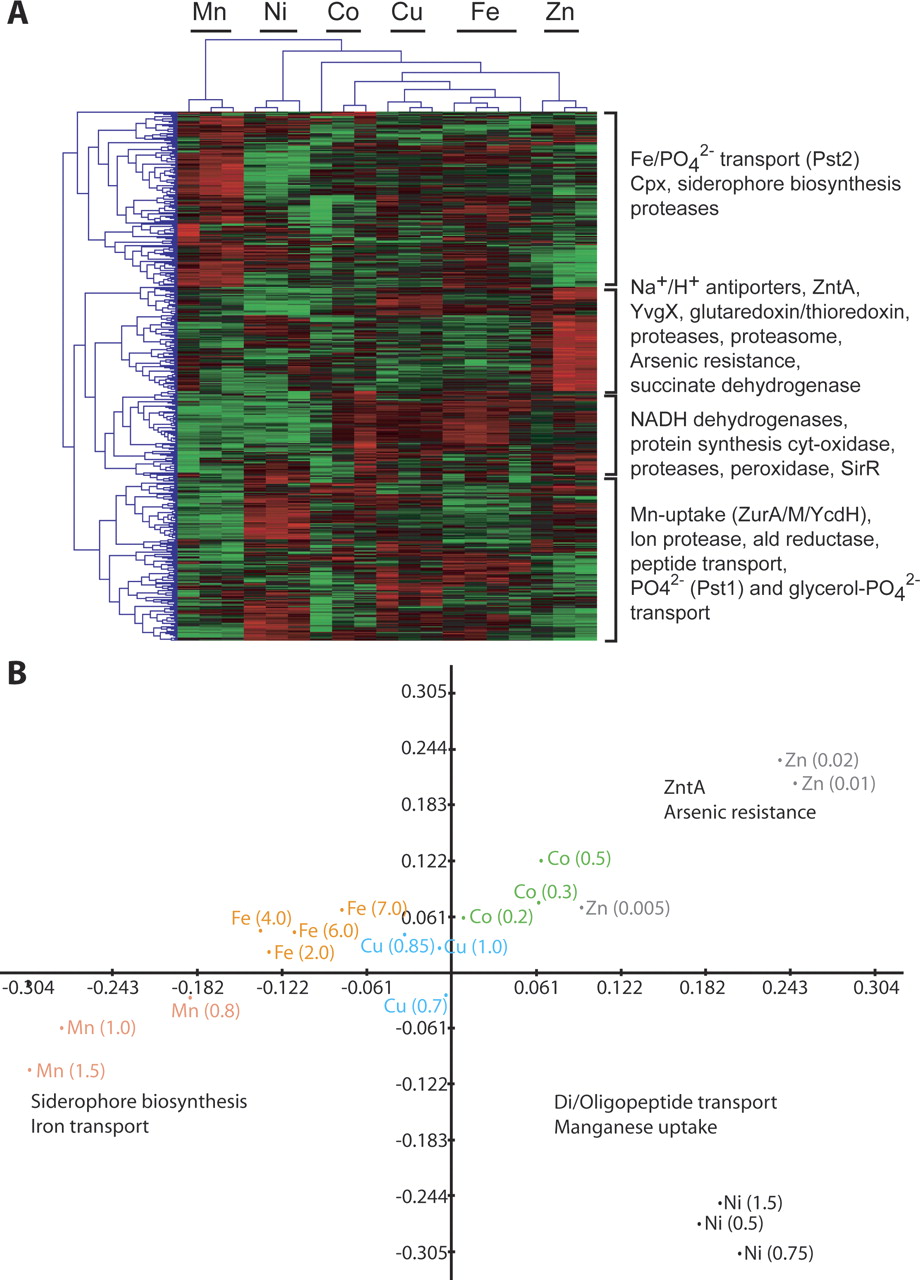
Correlation among responses to different transition metals. (A) Hierarchical clustering on normalized mRNA log10 ratios for 468 genes that changed significantly (λ > 15) in at least two conditions. (B) Correspondence analysis on the same data set illustrates relatedness among both experiments as well as genes (for sake of clarity, genes are not shown; instead, relative positions of some key functions are highlighted on the plot). Each dot in this graph represents an experiment; for example, Co (0.5) refers to mRNA level changes in 0.5 mM Co2+. Eigen values are plotted for each of the first two dimensions, indicated as Axes 1 and 2, which represent inertia values of 26.34 and 19.45, respectively.


