
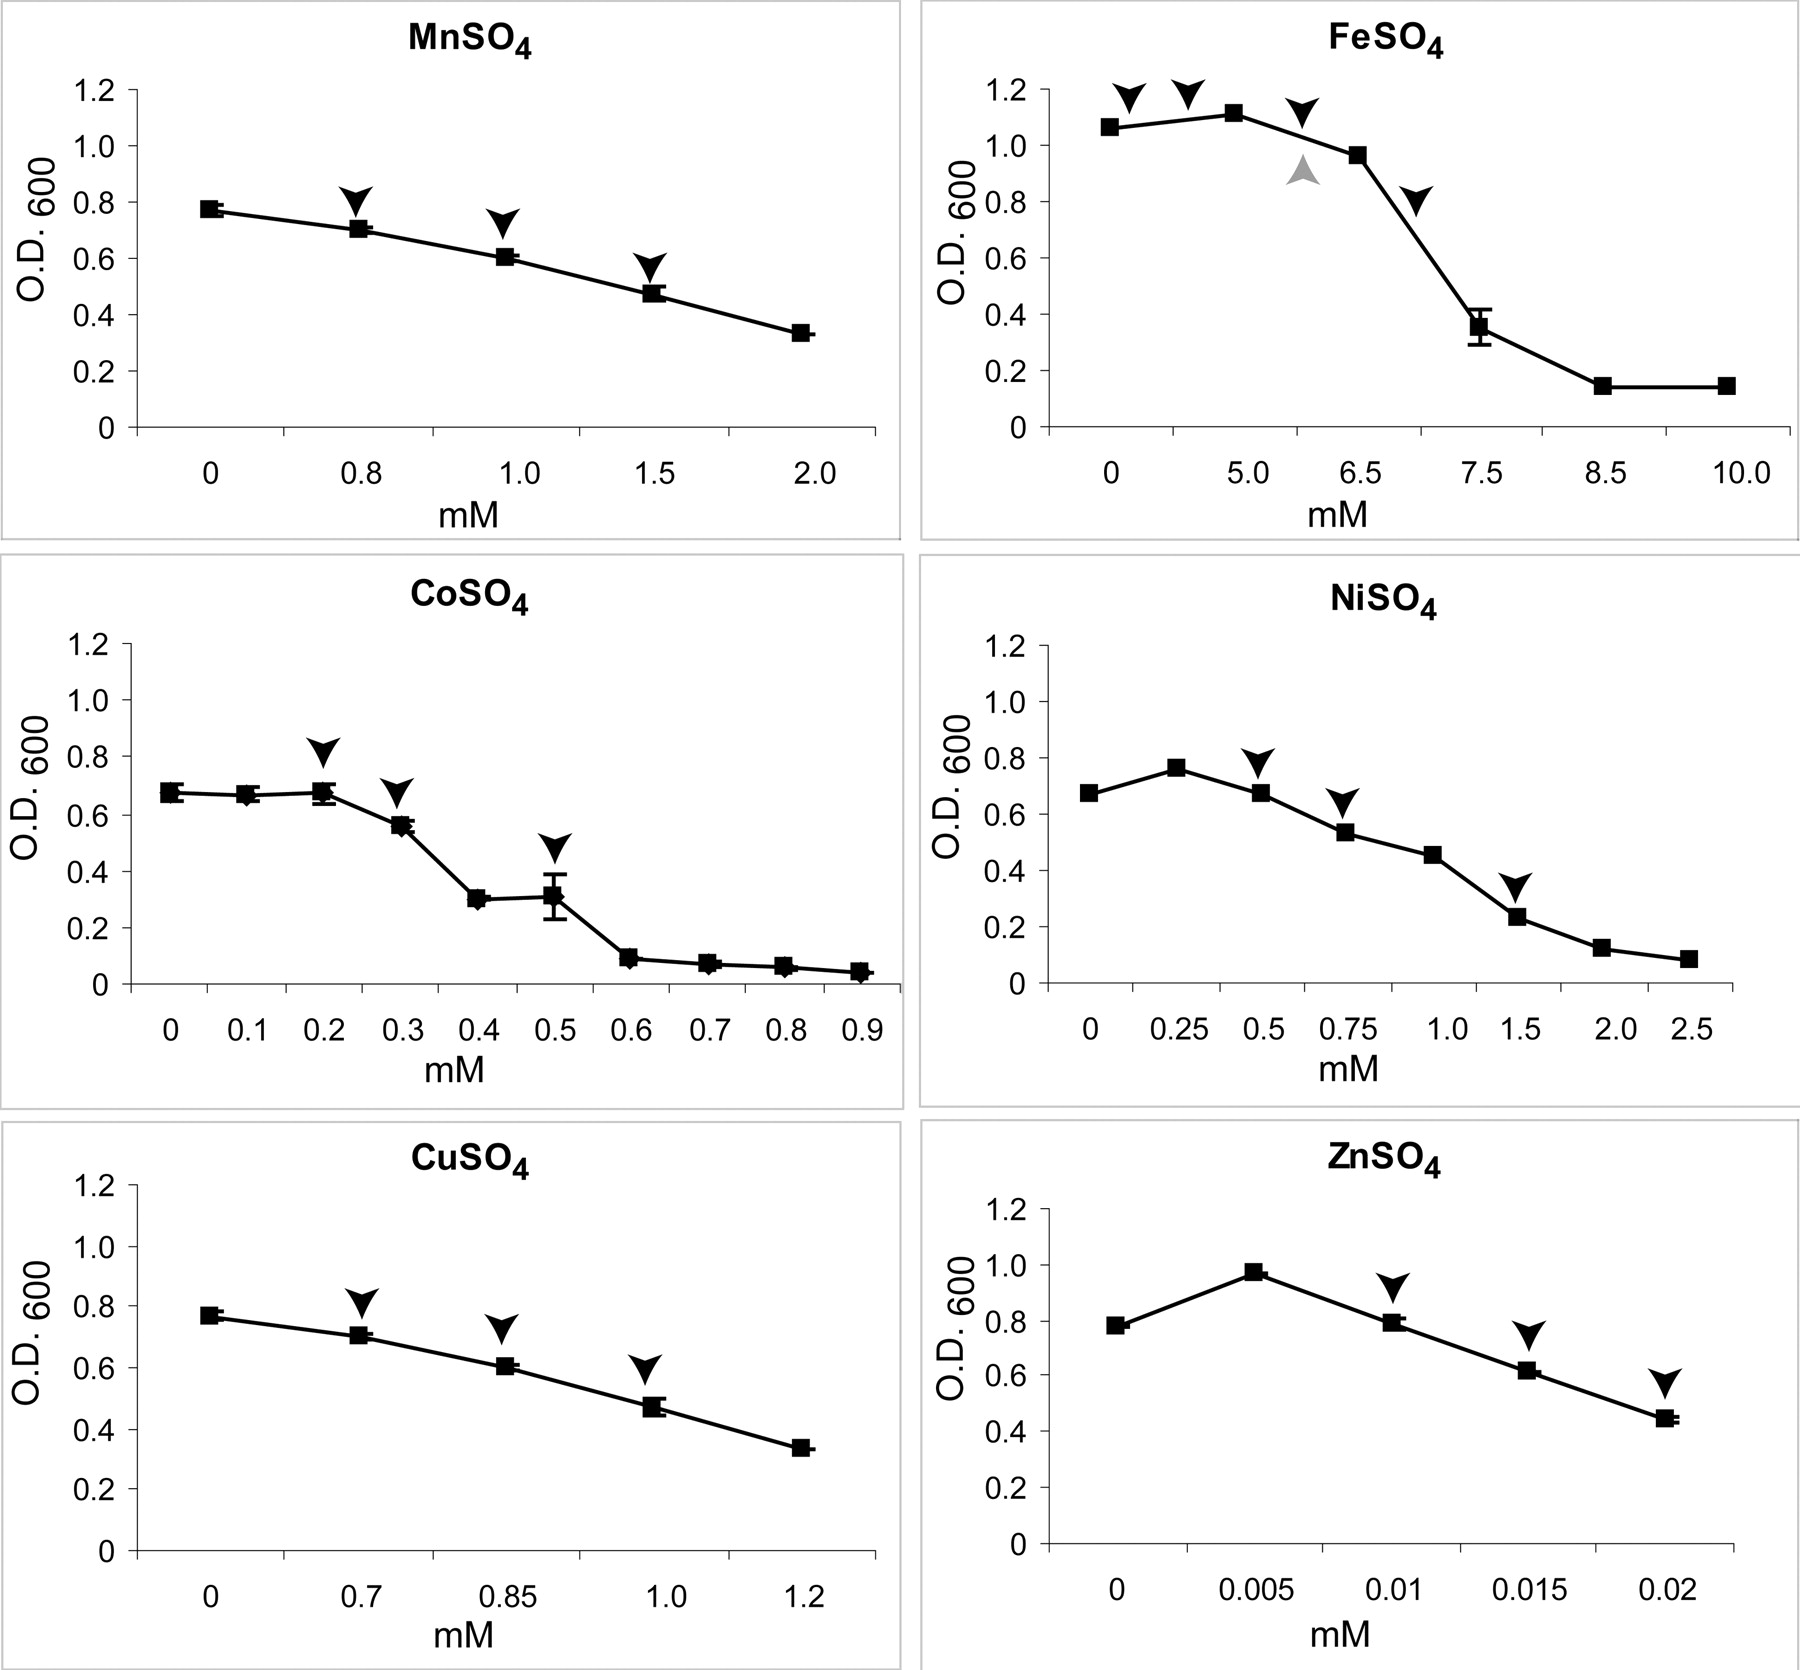
Figure 1.
Effect of six transition metals on growth of Halobacterium NRC-1. The average of at least three independent biological replicates is shown. The bars represent standard error. The black arrowheads above each curve indicate concentrations at which microarray analyses were conducted. The gray arrow in the Fe curve indicates concentration used for time course analysis.


