
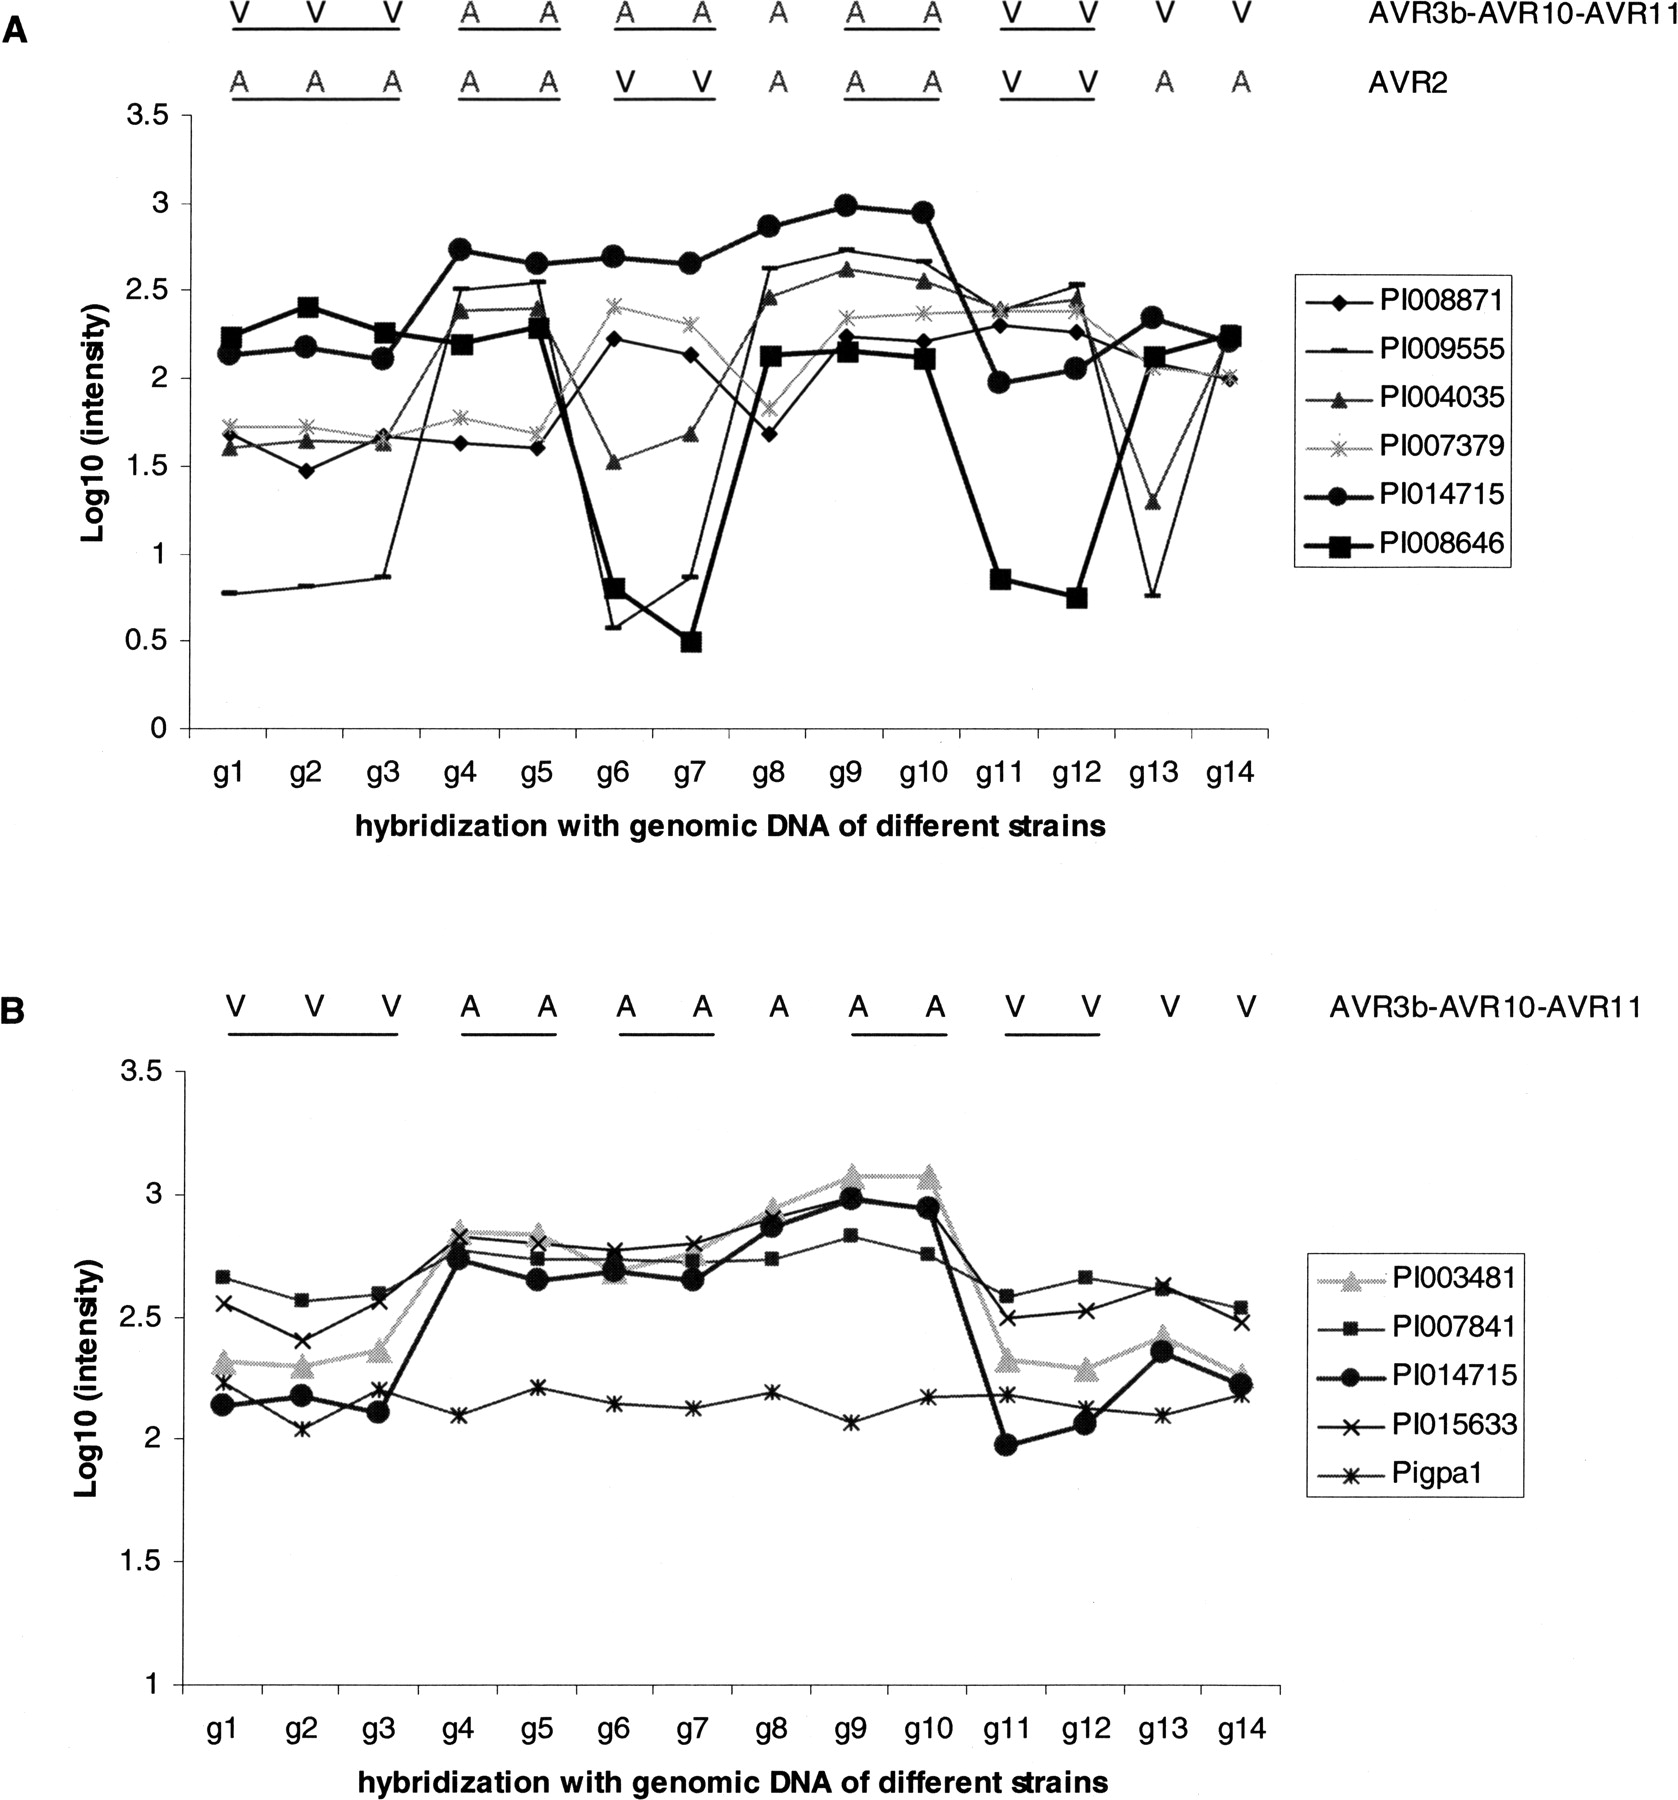
Array-CGH reveals copy number variation (CNV). The Phytophthora GeneChip was hybridized with genomic DNA derived from isolates T30-2 (g1, g2, g3), T15-5 (g4, g5), D12-17 (g6, g7), T30-3 (g8), T20-4 (g9, g10), D12-6 (g11, g12), 90128 (g13), and 88069 (g14). The phenotypes of the strains are indicated by V (virulent) or A (avirulent). Samples derived from the same strain are underlined. The y-axis shows the log10 of the hybridization intensity. (A) Eight array sequences representing six genes show CNV (standard deviation >0.5). Pi003481 and Pi004035 gave similar patterns as Pi014715 and Pi001829 (not shown here) respectively, and each of these pairs is derived from the same gene. Pi014715 and Pi008646 show correlations with avirulence phenotypes (AVR3b–AVR10–AVR11 and AVR2, respectively), whereas the other four show no correlation with any known phenotype. For further details see Supplemental Table S3. (B) Four array sequences derived from pi3.4 show an AVR3b–AVR10–AVR11-correlated CNV. The array sequence representing the single-copy gene Pigpa1 was plotted as control.


