
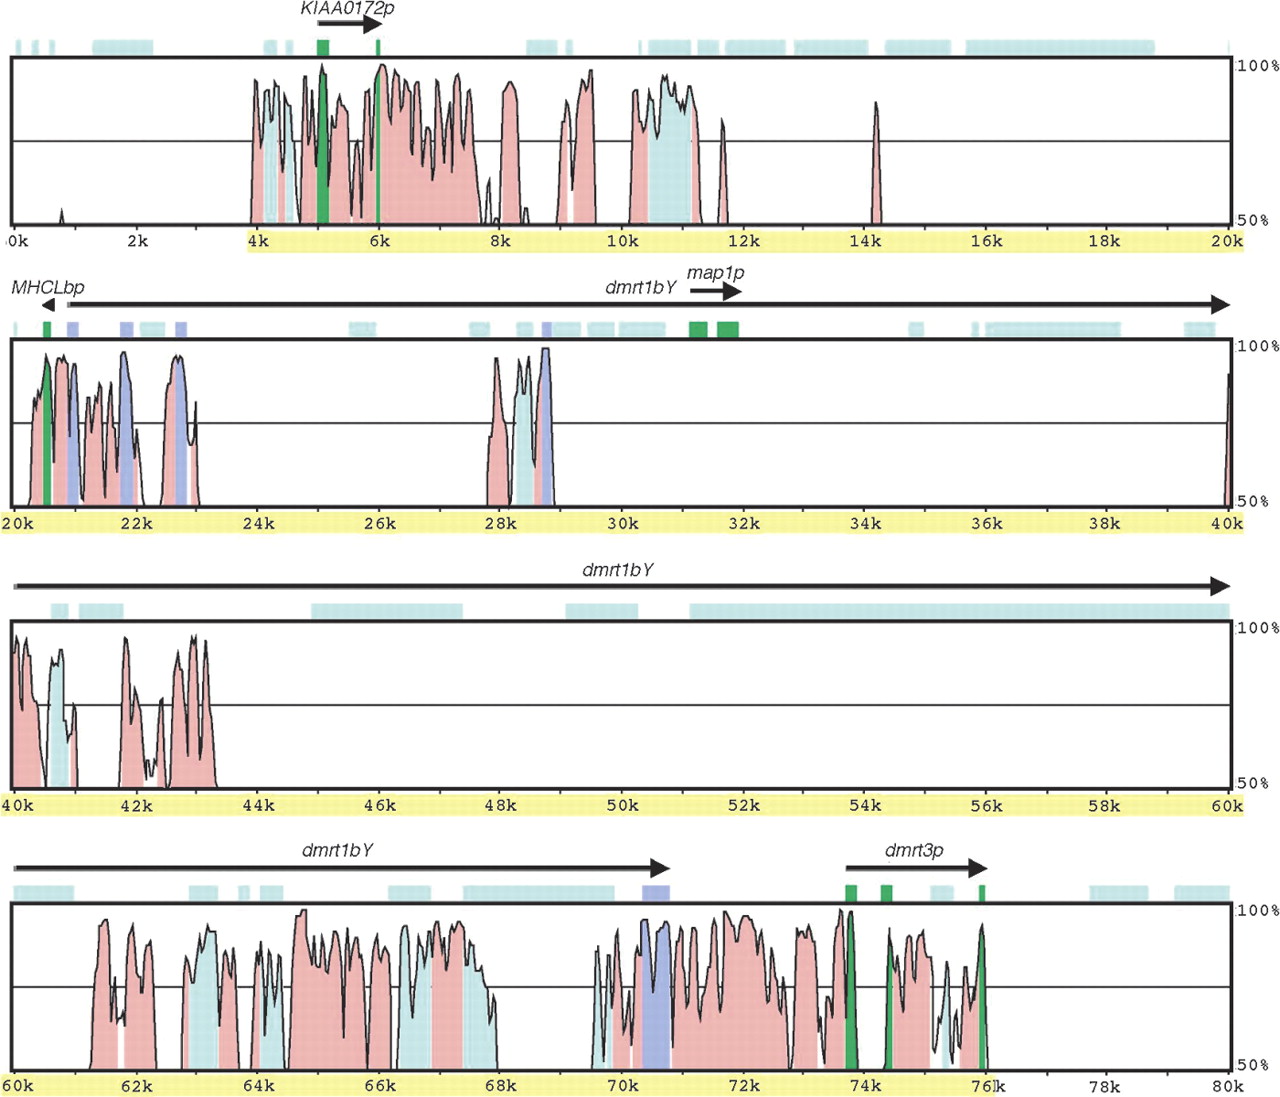
Figure 7.
Comparison of the Y-core and LG9-core sequences. The Y-core sequence (72.1 kb) (shaded yellow) and ∼4 kb each on both sides was compared to the LG9-core sequence (42.9 kb) and ∼5 kb each on both sides using VISTA. The level of conservation (vertical axis) is displayed in the coordinates of the Y-core sequence (horizontal axis). Conserved regions above the level of 70%/100 bp are shaded under the curve, with pink indicating a conserved non-coding region, purple a conserved exon, and green a pseudogene. The light blue shades label the masked sequences using our database.


