
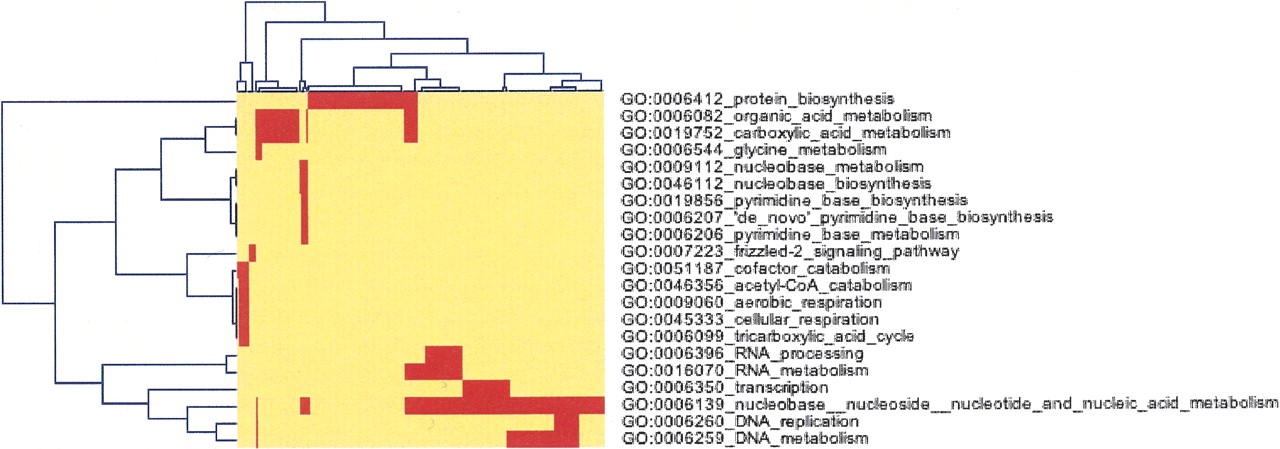
Clustered Image Map of genes with no paralog versus GO categories for categories with significant enrichment. Thumbnail clustered image map (CIM) of genes (top) versus categories (right) for categories with a false discovery rate (FDR) ≤0.10. Very large generic categories have been removed to improve visualization. Clustering was performed with the Genesis Client (Sturn et al. 2002; http://genome.tugraz.at/Software/GenesisCenter.html). Three major clusters can be seen. Processes involved in general metabolism (far left) include “cofactor catabolism,” “acetyl-CoA catabolism,” “aerobic respiration,” “cellular respiration,” and “tricarboxylic acid cycle.” Processes involved in nucleic acid processing (bottom right) include “RNA metabolism,” “transcription,” “nucleobase metabolism,” “DNA replication,” and “DNA metabolism.” The third cluster contains GO categories involved in nucleoside metabolism such as “nucleobase metabolism,” “pyrimidine base biosynthesis,” and “nucleobase biosynthesis.” The full-size CIM in which all genes are displayed is available as Supplemental Figure S6.


