
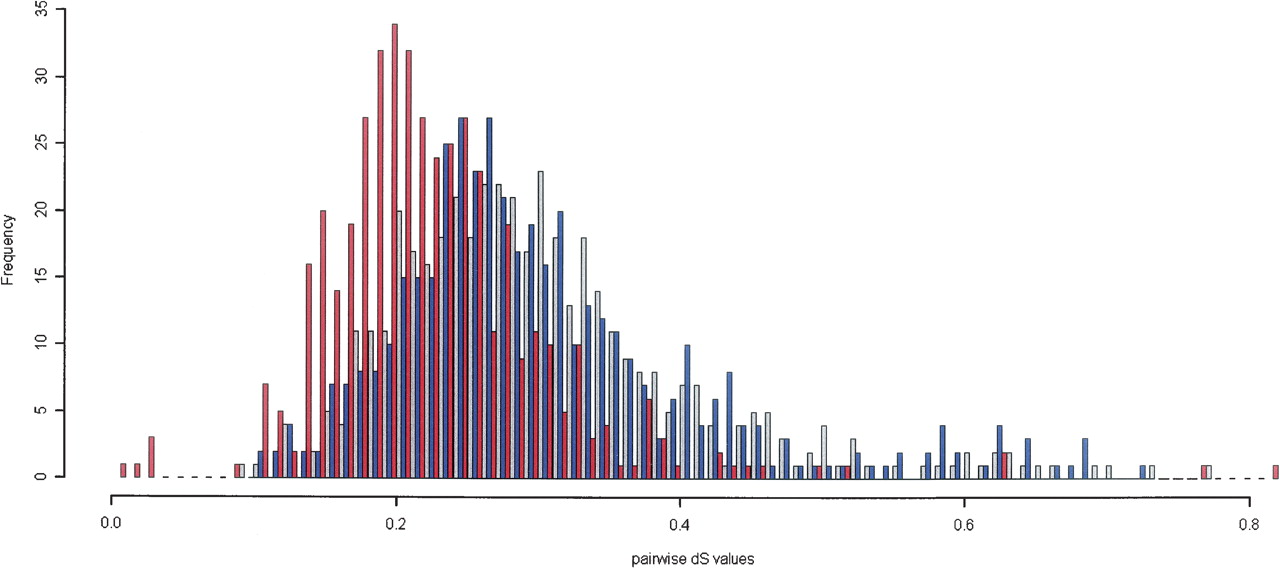
Figure 2.
Distribution of dS for pairwise comparisons between paralogs and orthologs. Distribution of dS from pairwise comparison between X. laevis paralogs (red) and from pairwise comparisons between each X. laevis paralog from a trio with its X. tropicalis ortholog (blue and gray). The small number (eight in total) of dS values that were >1 were eliminated to provide an appropriate scale.


