
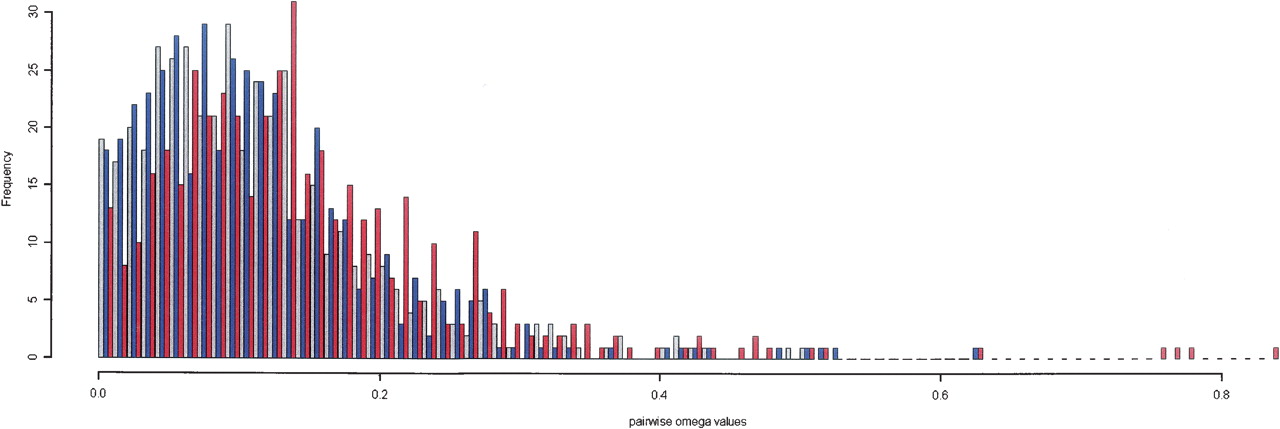
Figure 1.
Frequencies of dN/dS ratio (ω) for pairwise comparisons between X. laevis and X. tropicalis genes. The distribution of dN/dS from pairwise comparisons of genes within gene trios is shown. ωs from X. laevis paralog pairs (shown in red) indicate a weaker selective constraint than the ω obtained from the comparisons of X. laevis paralogs with their X. tropicalis ortholog (shown in gray and blue). The ωs from both paralog–ortholog pairs follow a similar distribution with a lower median than the ω obtained from the paralogs in each trio (P = 2.184 × 10⁻⁷).


