
Table 1
Comparison of two SFP marker detection methods for numbers of markers obtained
Click on table to view larger version.
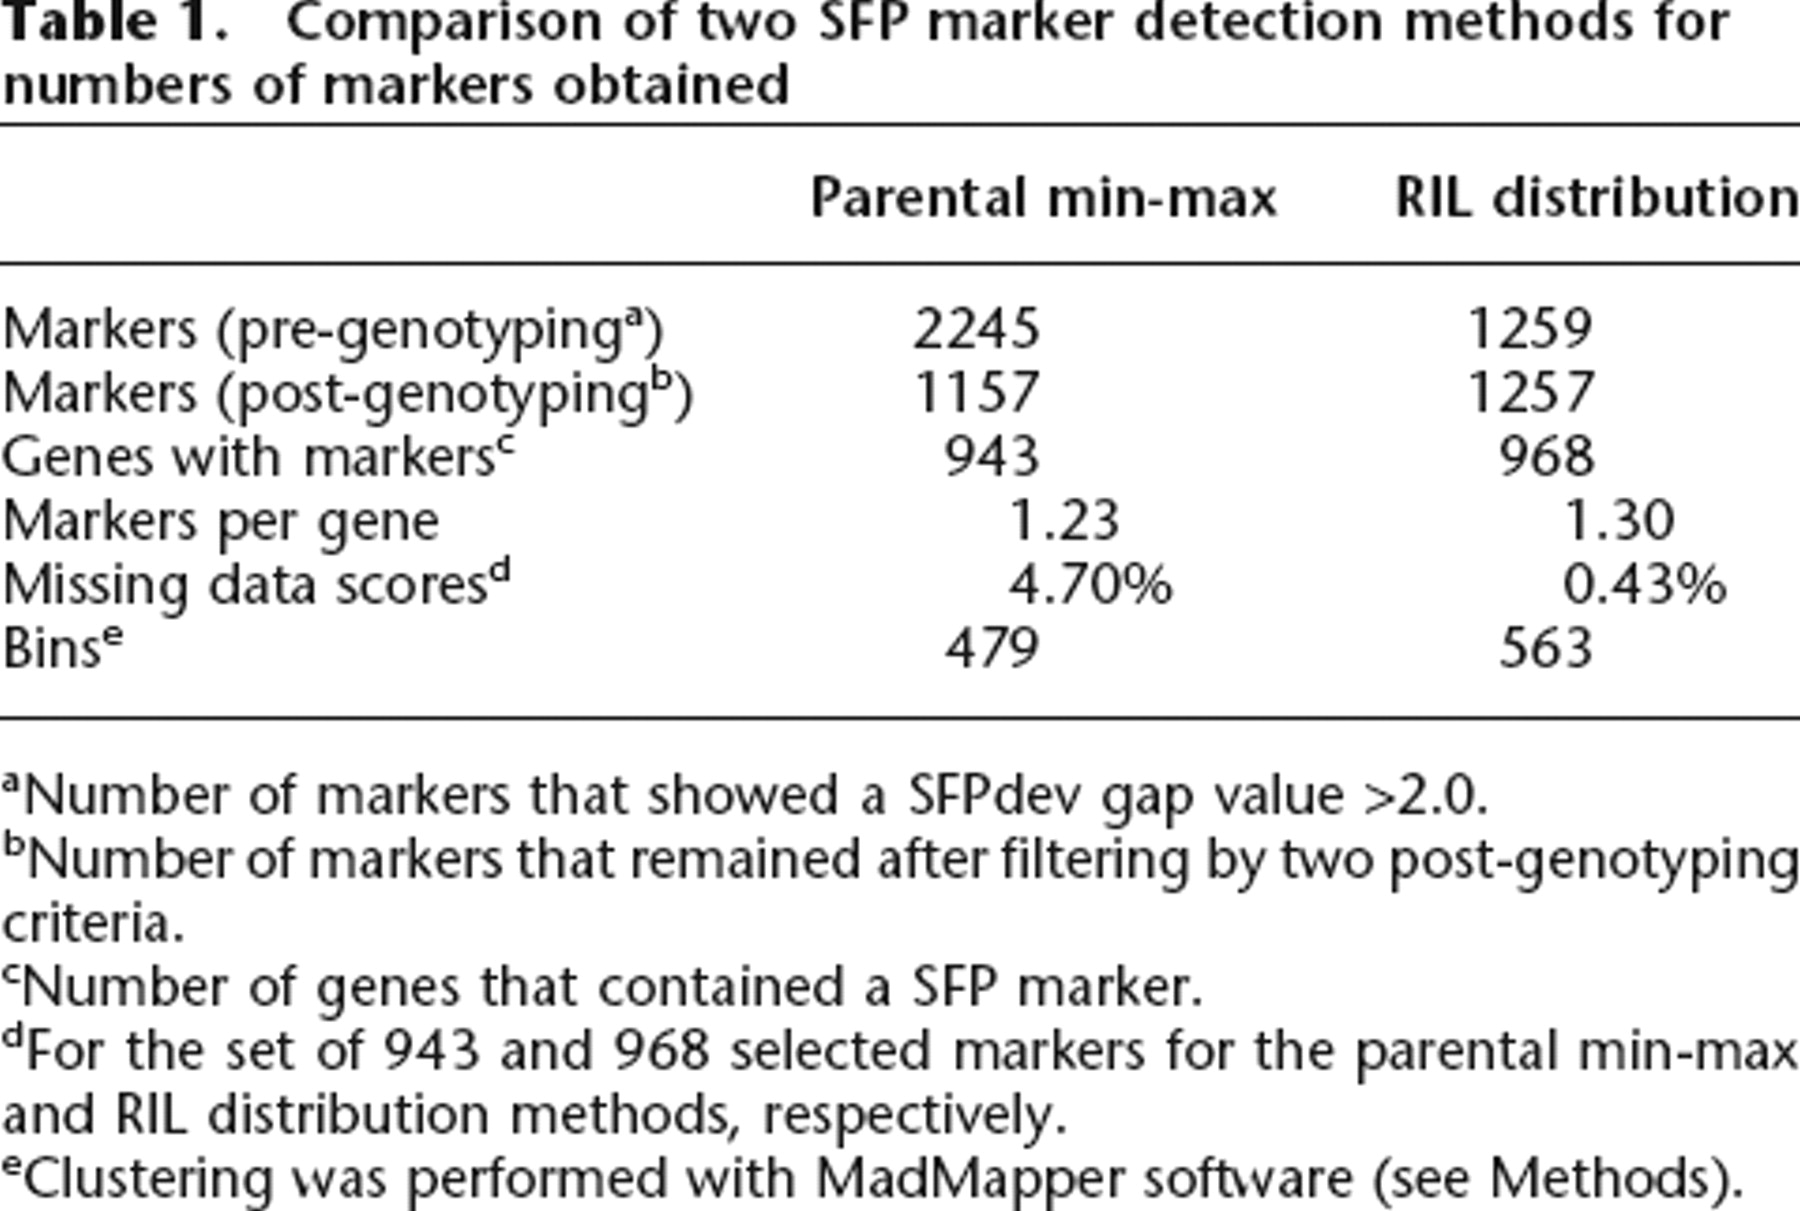
aNumber of markers that showed a SFPdev gap value >2.0.
bNumber of markers that remained after filtering by two post-genotyping criteria.
cNumber of genes that contained a SFP marker.
dFor the set of 943 and 968 selected markers for the parental min-max and RIL distribution methods, respectively.
eClustering was performed with MadMapper software (see Methods).


