
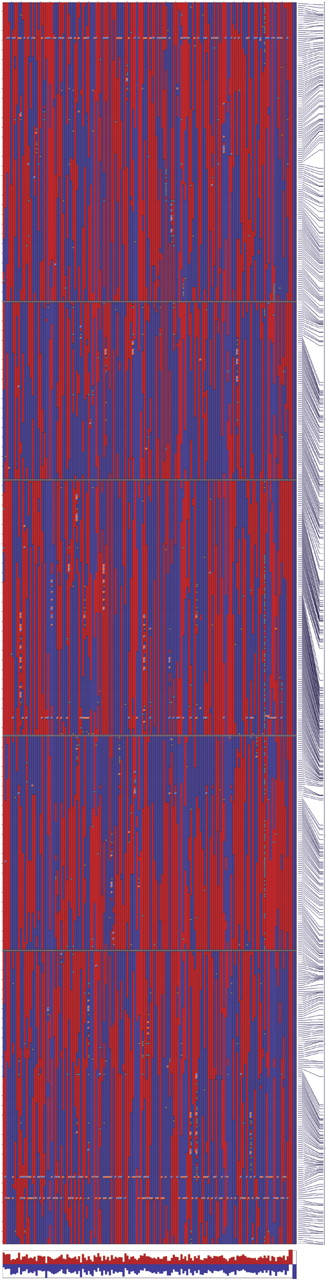
Haplotypes of 148 RILs plus parental genotypes. Each column represents a RIL (first 148 columns) or parental genotype (last four columns). Rows correspond to SFP and microsatellite markers, arranged (top to bottom) in physical order based on the Col-0 genomic sequence. The five Arabidopsis linkage groups are laid end-to-end and are separated by horizontal gray lines. Red boxes indicate Sha genotypes, blue boxes indicate Bay-0 genotypes, and gray boxes indicate markers scored as missing data. The final column depicts the physical distances between the markers. Below the haplotypes, the proportions of Sha (red bars) and Bay-0 (blue bars) alleles in each RIL are depicted. (A high resolution version of this figure, with marker names included, is available in Supplemental Fig. 6a)


