
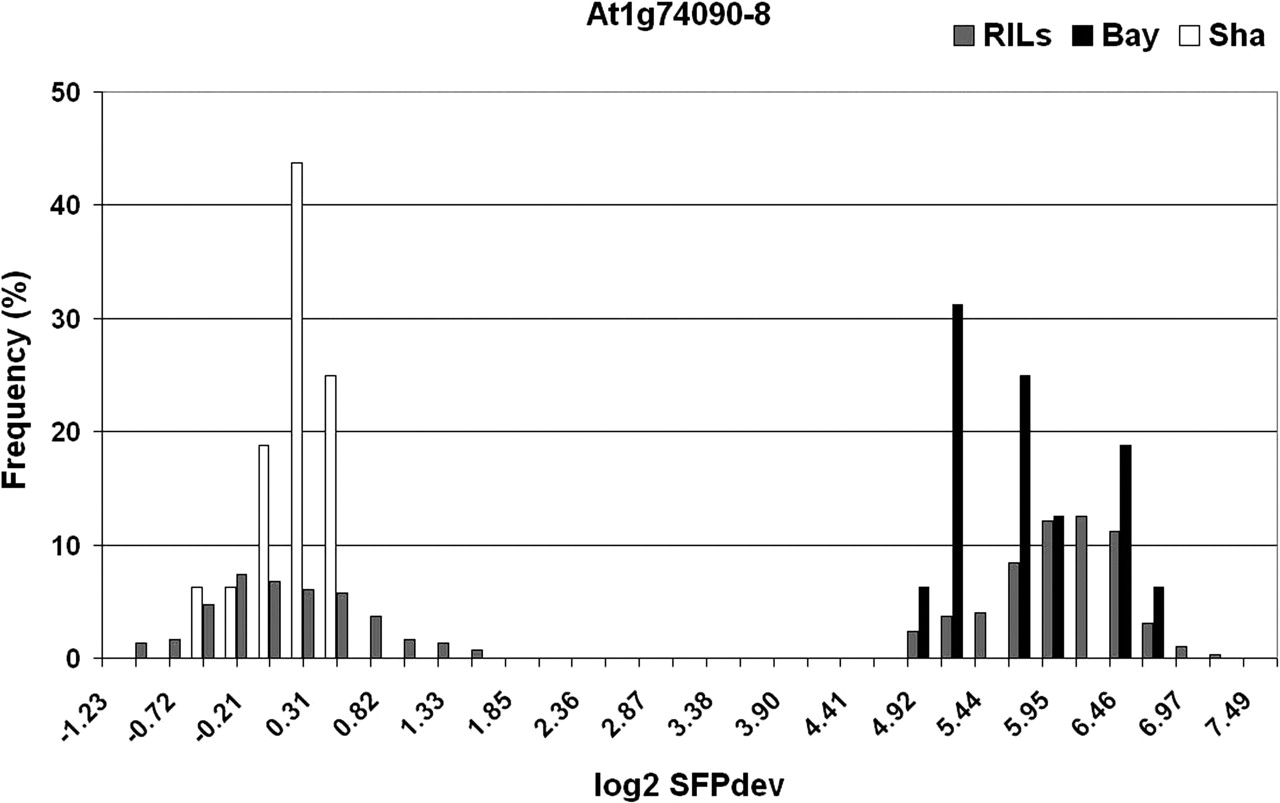
Figure 1.
Comparison of SFPdev distributions between RIL and parental GeneChips. The distribution of SFPdev values (x-axis) in the RIL population (gray bars) are compared to distributions in the parental Bay-0 and Sha GeneChips from the factorial experiments (black and white bars, respectively) for SFP marker At1g74090-8 with 24.3% missing data (when scored with the parental min-max algorithm).


