
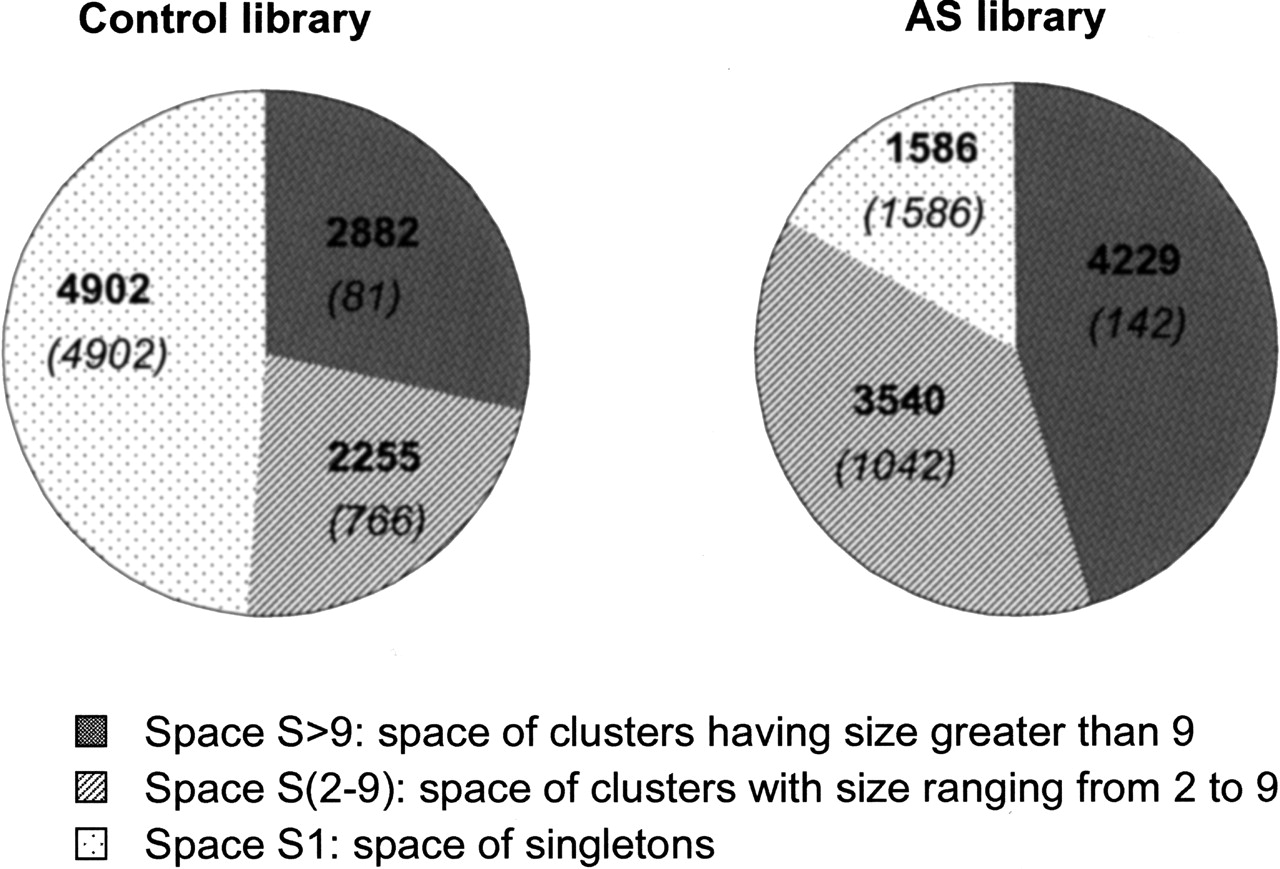
Figure 3.
Space composition of the Control and AS libraries. For each space, the number of ESTs and ASSETs (in bold characters) and the corresponding number of clusters (in italic and in parentheses) are indicated. The areas of the spaces are proportional to the number of ESTs or ASSETs, not to the number of clusters.


