
Table 3
Mixture model estimates for Ks distributions in each species
Click on table to view larger version.
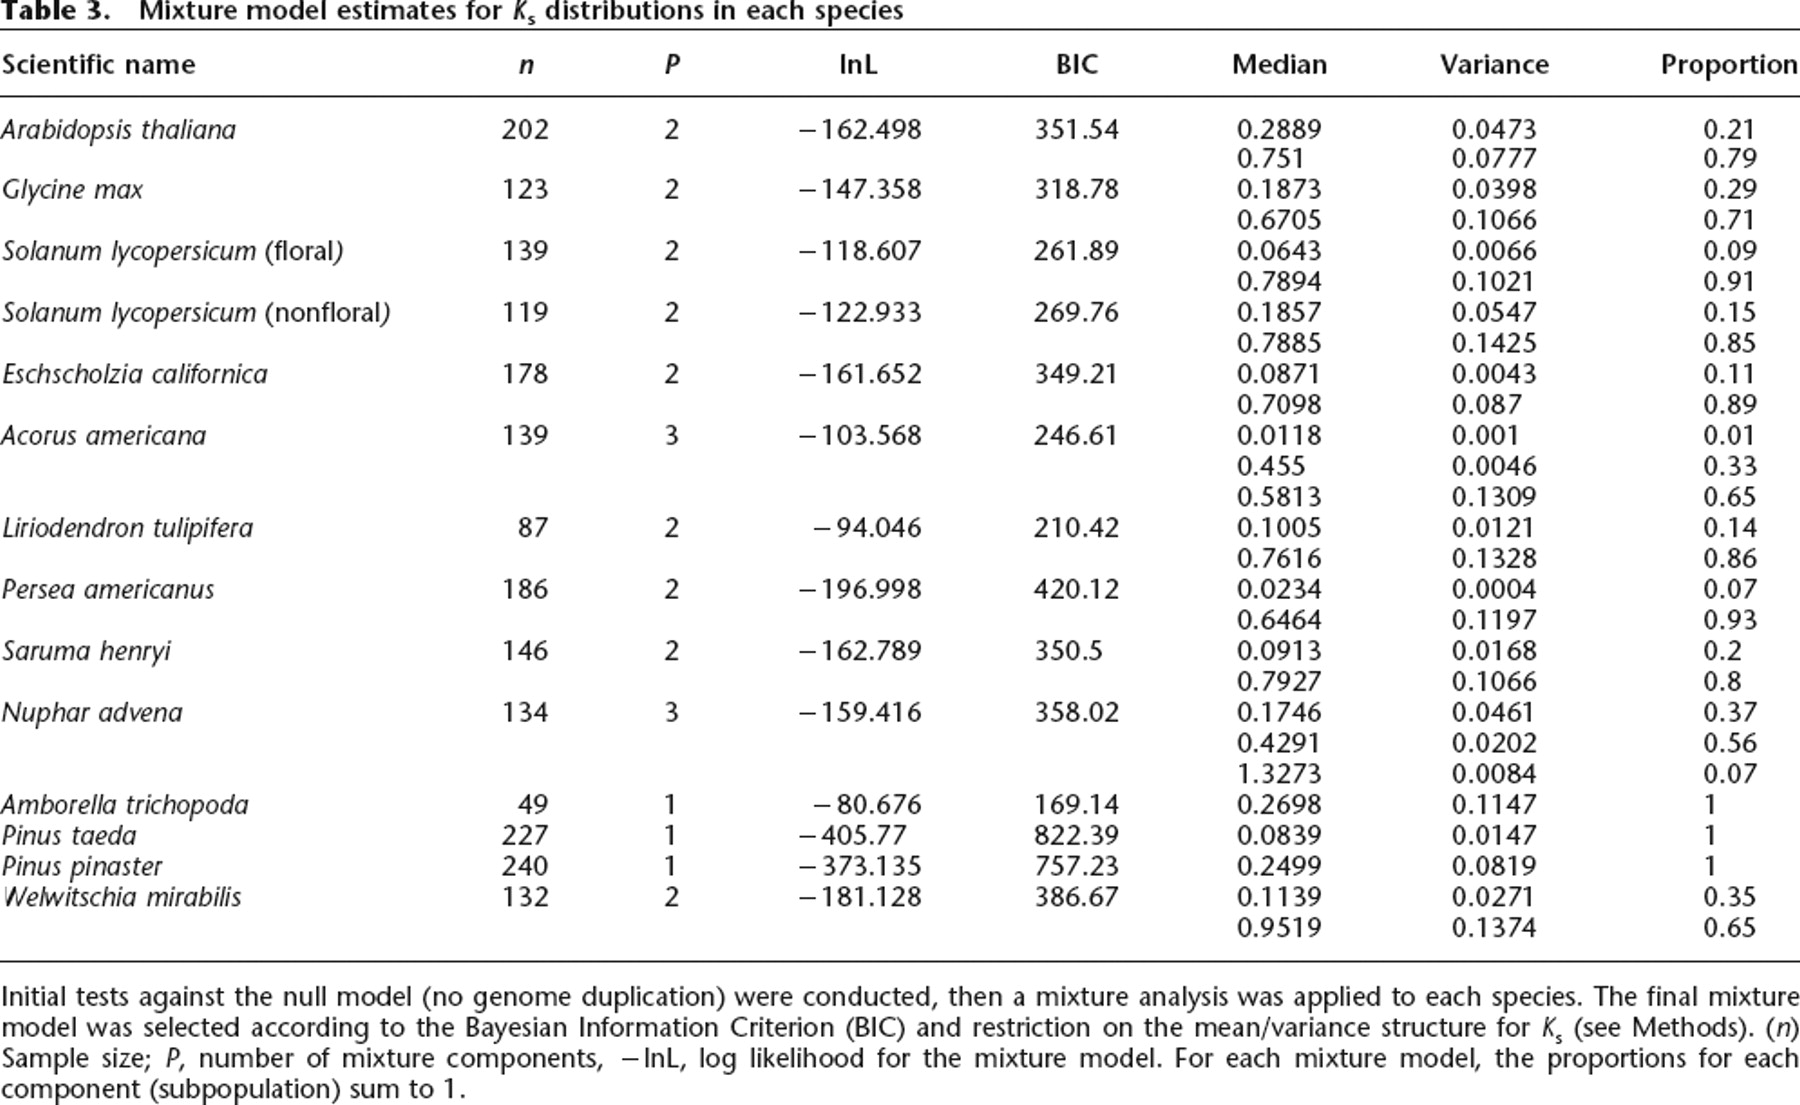
Initial tests against the null model (no genome duplication) were conducted, then a mixture analysis was applied to each species. The final mixture model was selected according to the Bayesian Information Criterion (BIC) and restriction on the mean/variance structure for Ks (see Methods). (n) Sample size; P, number of mixture components, −lnL, log likelihood for the mixture model. For each mixture model, the proportions for each component (subpopulation) sum to 1.


