
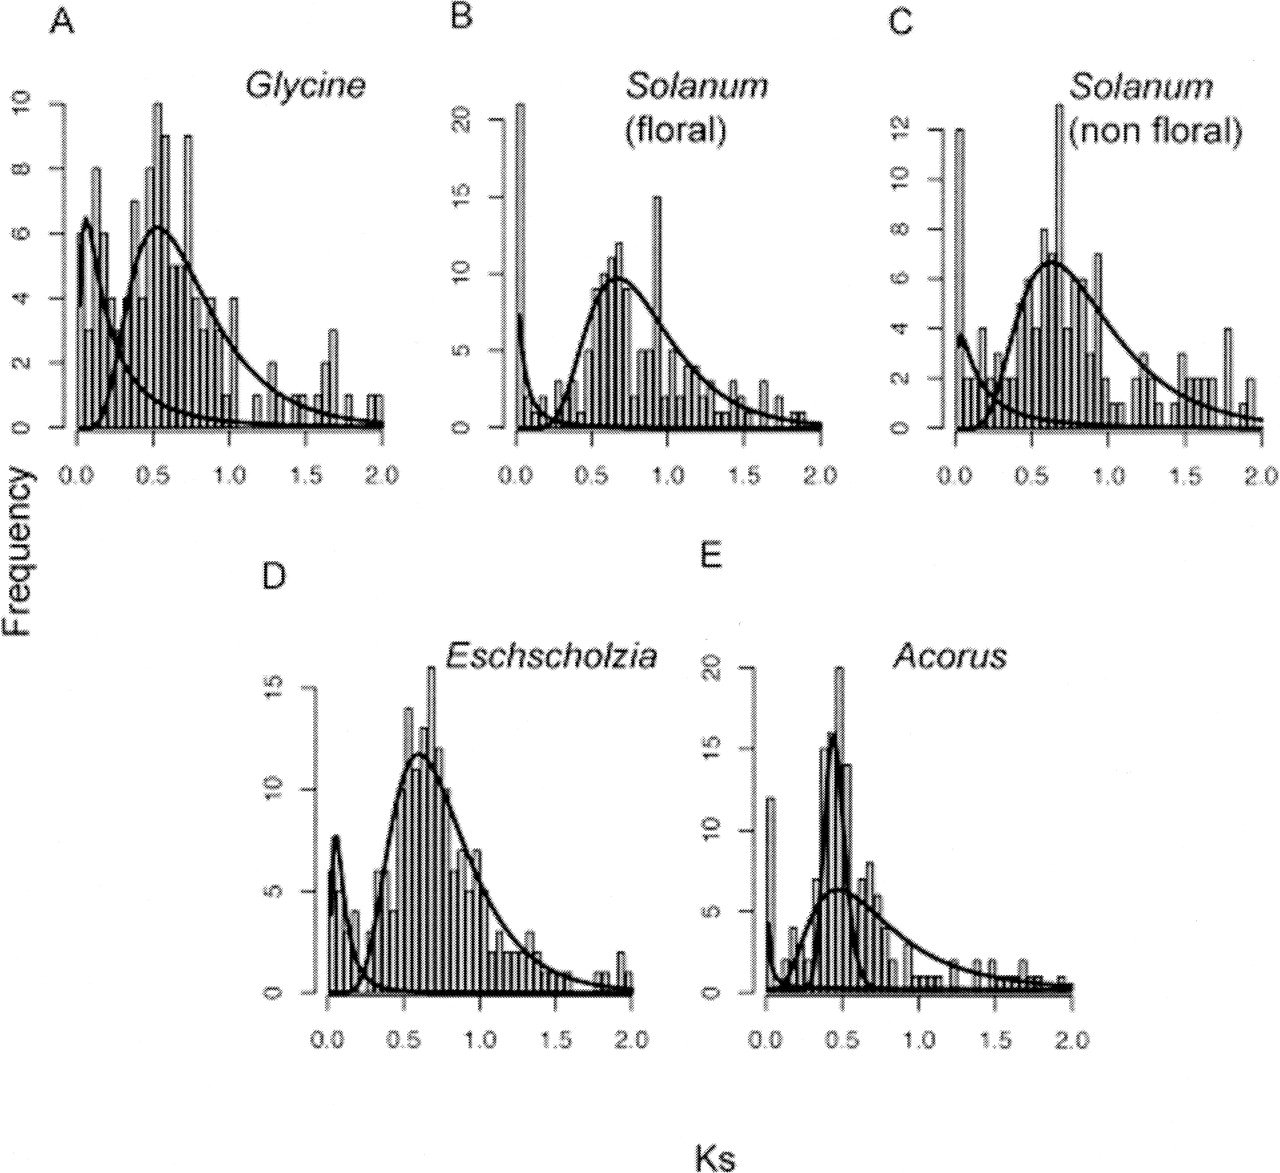
Figure 3.
Ks distributions of paralogs in selected angiosperm species, with fitted densities from mixture model analysis, suggest paleopolyploidy in eudicots and monocots. Each fitted line indicates a subpopulation in the mixture. The first (leftmost) component corresponds to paralogs from background gene duplications; other peaks indicate estimated median Ks for ancient duplications. (A) Glycine max (soybean). (B,C) Solanum lycopersicum (tomato), data from floral tissue (B) and nonfloral tissue (C). (D) A basal eudicot, Eschscholzia californica (California poppy). (E) A basal monocot, Acorus americanus.


