
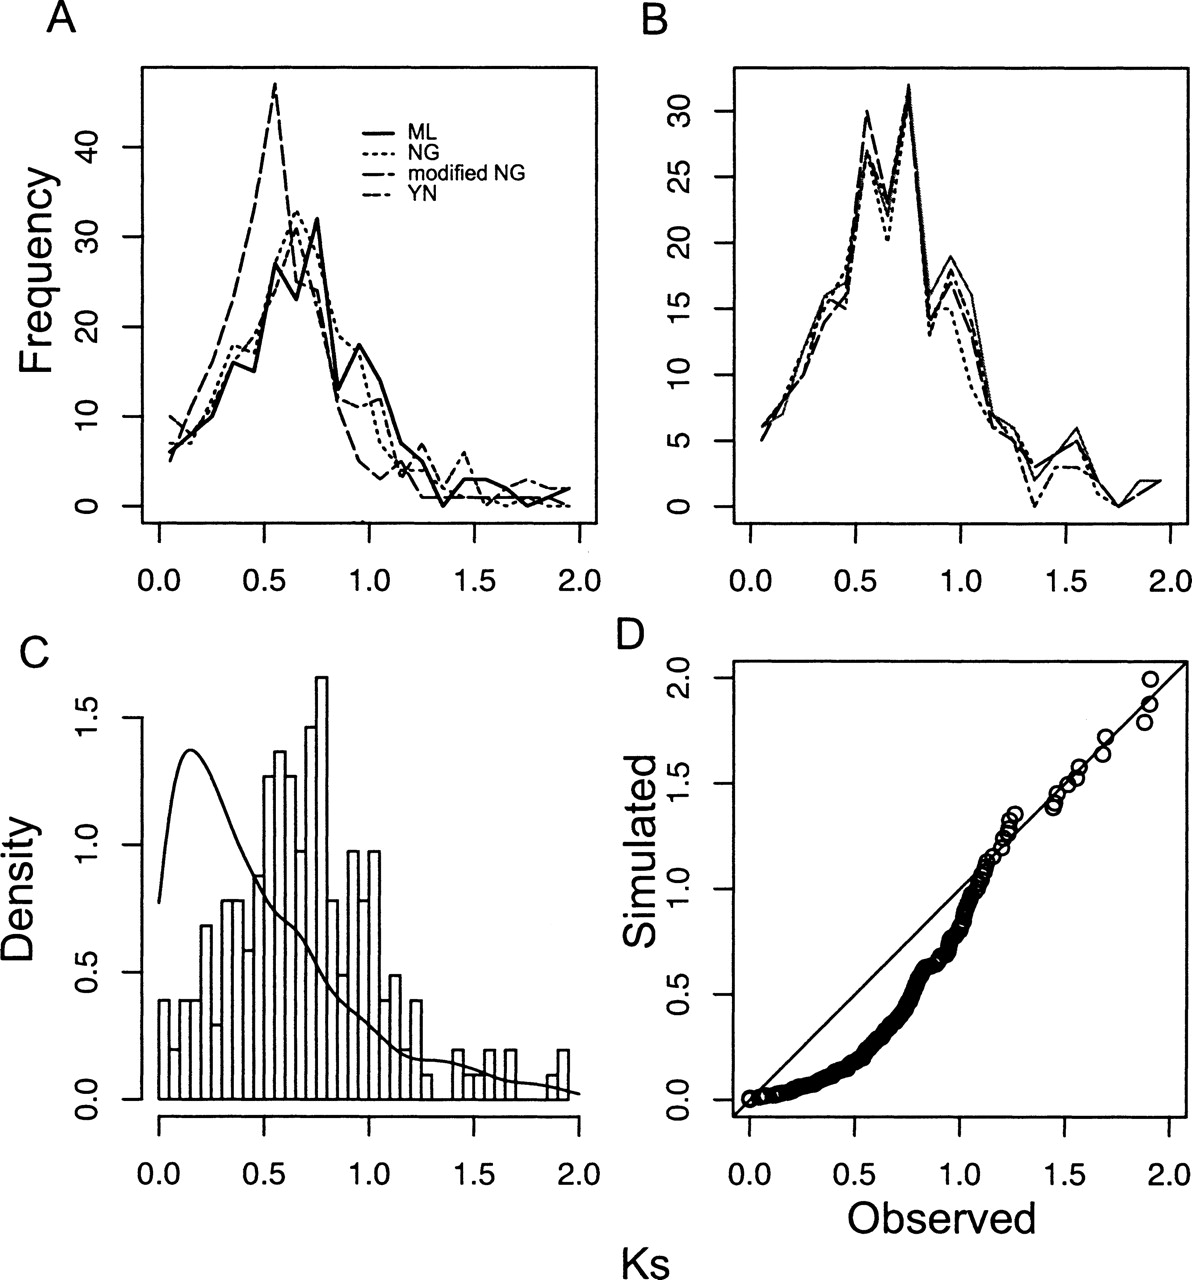
Ks distribution from a sample of Arabidopsis unigenes and the diagnostic test according to the constant birth–death model (null model). (A) Ks estimates from four methods show strong agreement. (ML) Maximum likelihood method by Goldman and Yang; (NG) Nei-Gojobori method; (mNG) modified Nei-Gojobori method; (YN) Yang and Nielsen method. These sample sizes are comparable to the unigenes available for the species sequenced in this study. (B) Ks distributions for paralogs from four replicate unigene samples of 6000 sequences each. (C) The density plot of observed Ks distribution and simulated data based on the null model with parameter δ = 0.67. (D) The Q-Q plot of observed versus expected Ks values shows the poor fit of the null hypothesis that gene birth and death rates are constant (P ≪ 0.0001).


