
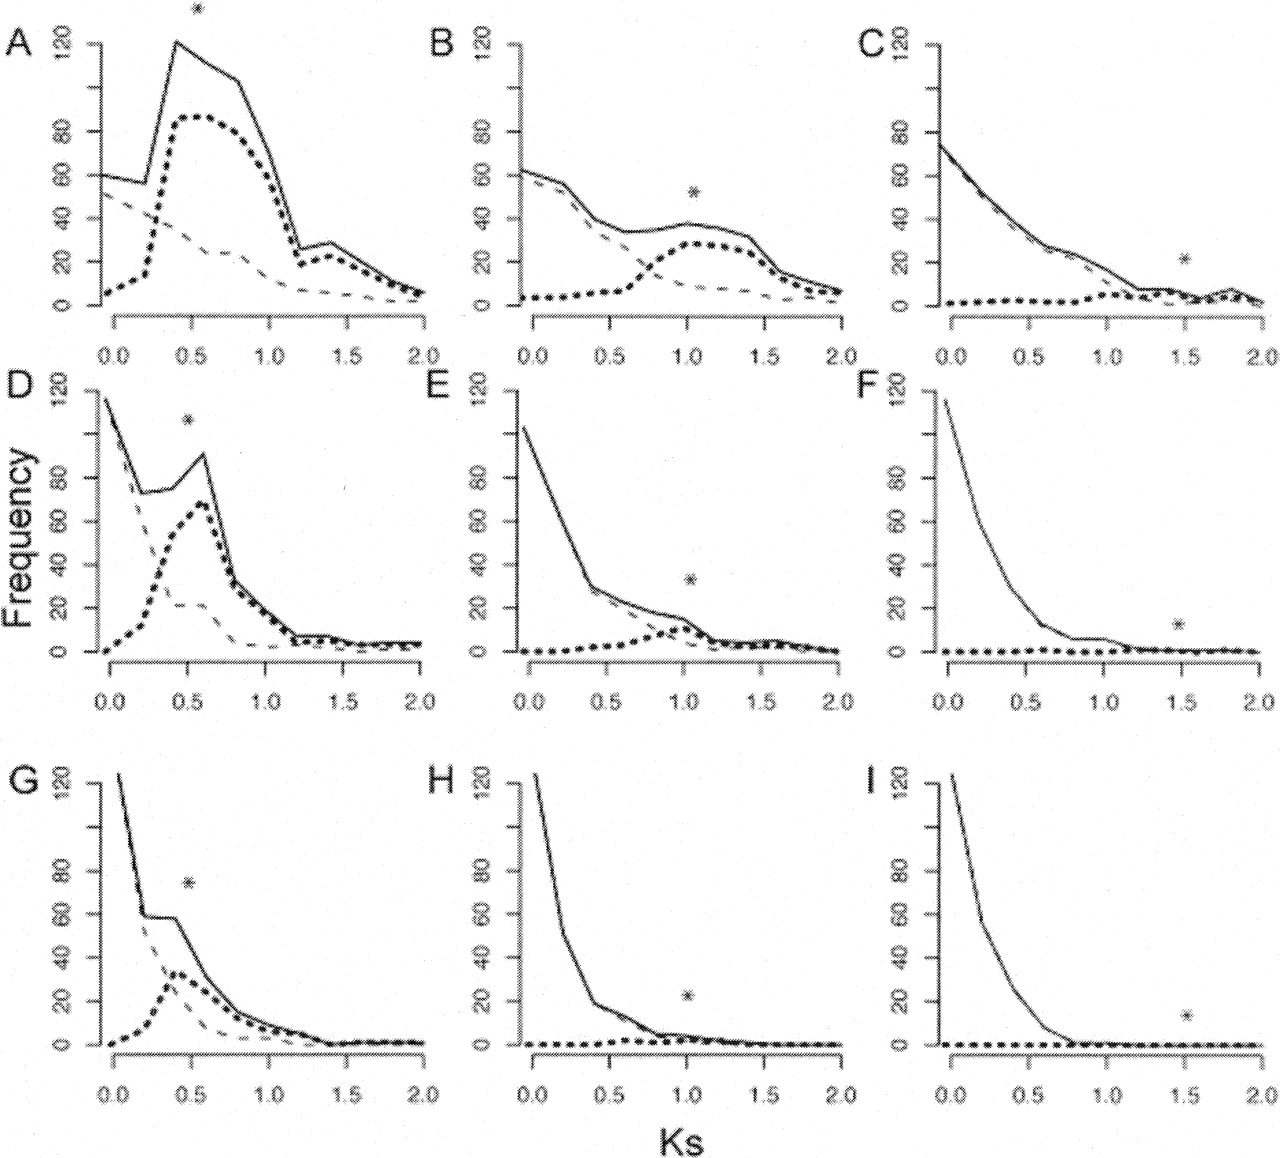
Effect of gene death rate and time of genome duplication on the Ks distribution for paralogs. A single genome duplication was simulated, where time since duplication (corresponding to Ks = 0.5 in A,D, and G; 1.0 in B,E, and H; or 1.5 in C,F, and I) is indicated by a star. The death rate of duplicate pairs (δ) increases from the top row to the bottom row (δ = 0.67 for A,B,C, as estimated from Arabidopsis data; 1.34 for D,E,F; and 2.68 for G,H,I). In each graph, the observed frequency of paralogs from background gene duplication is plotted with a dashed line, while the distribution deriving from genome duplication is plotted with a dotted line. The Ks distribution of all paralogs is drawn with a solid line.


