
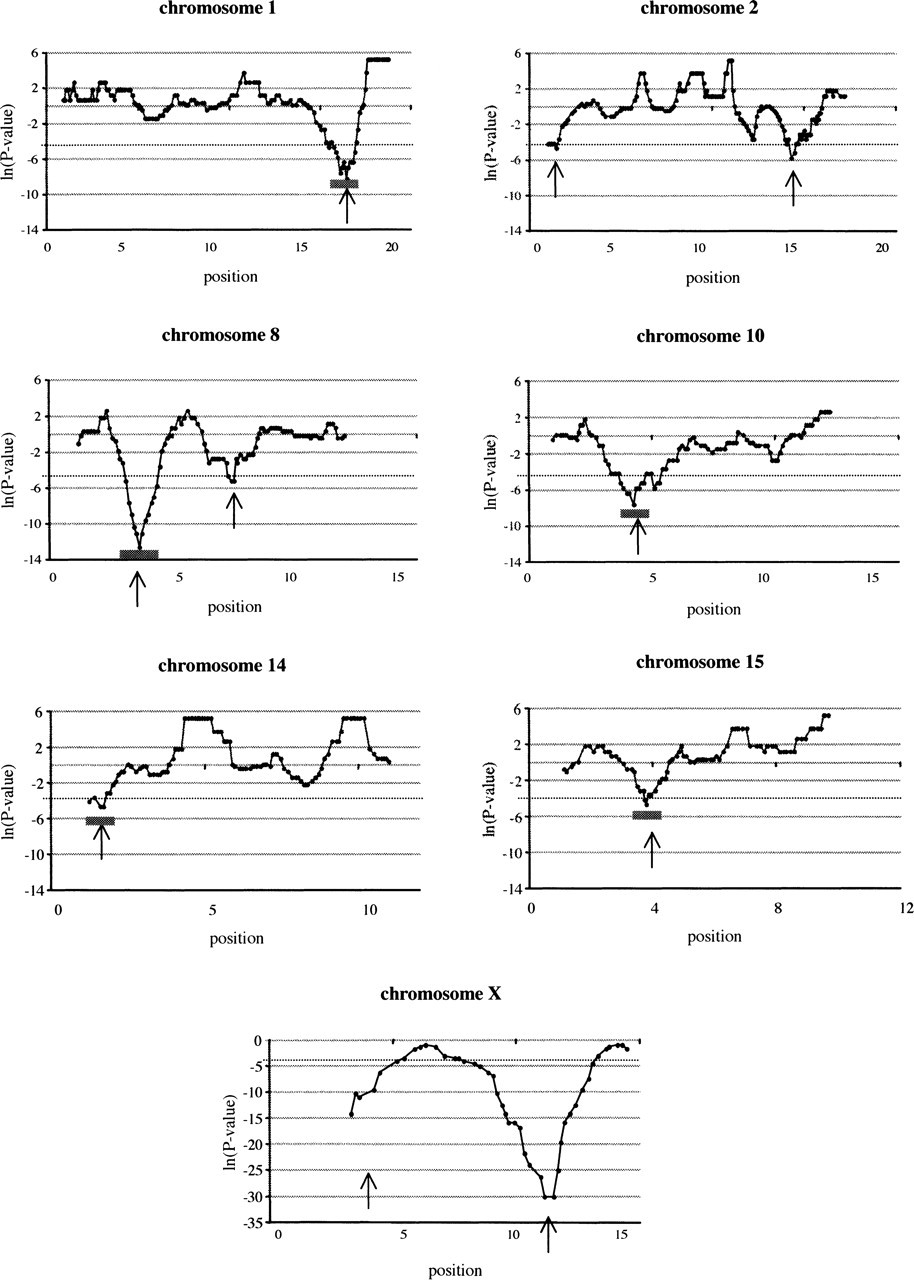
Signed ln-transformed P-values from a χ2 analysis of a sliding window plotted against chromosomal position (midpoint of a sliding window). Positive values on the y-axis indicate a deficiency in the number of fixed differences between the subspecies while negative values indicate more fixed differences than expected. Sliding windows consist of 60 SNPs moved for five SNP each step. (Dashed line) Significance level for a surplus of fixed differences among subspecies, (arrows) regions of significantly elevated differentiation, (short horizontal gray bars) regions that were chosen for direct sequencing of independent samples of M. m. musculus and M. m. domesticus. Only chromosomes where significant differentiation was found are shown. Note that the y-axis of the X chromosome differs from those of the autosomes because of the overall much higher differentiation of the X. Base positions on the x-axis need to be multiplied by 107.


