
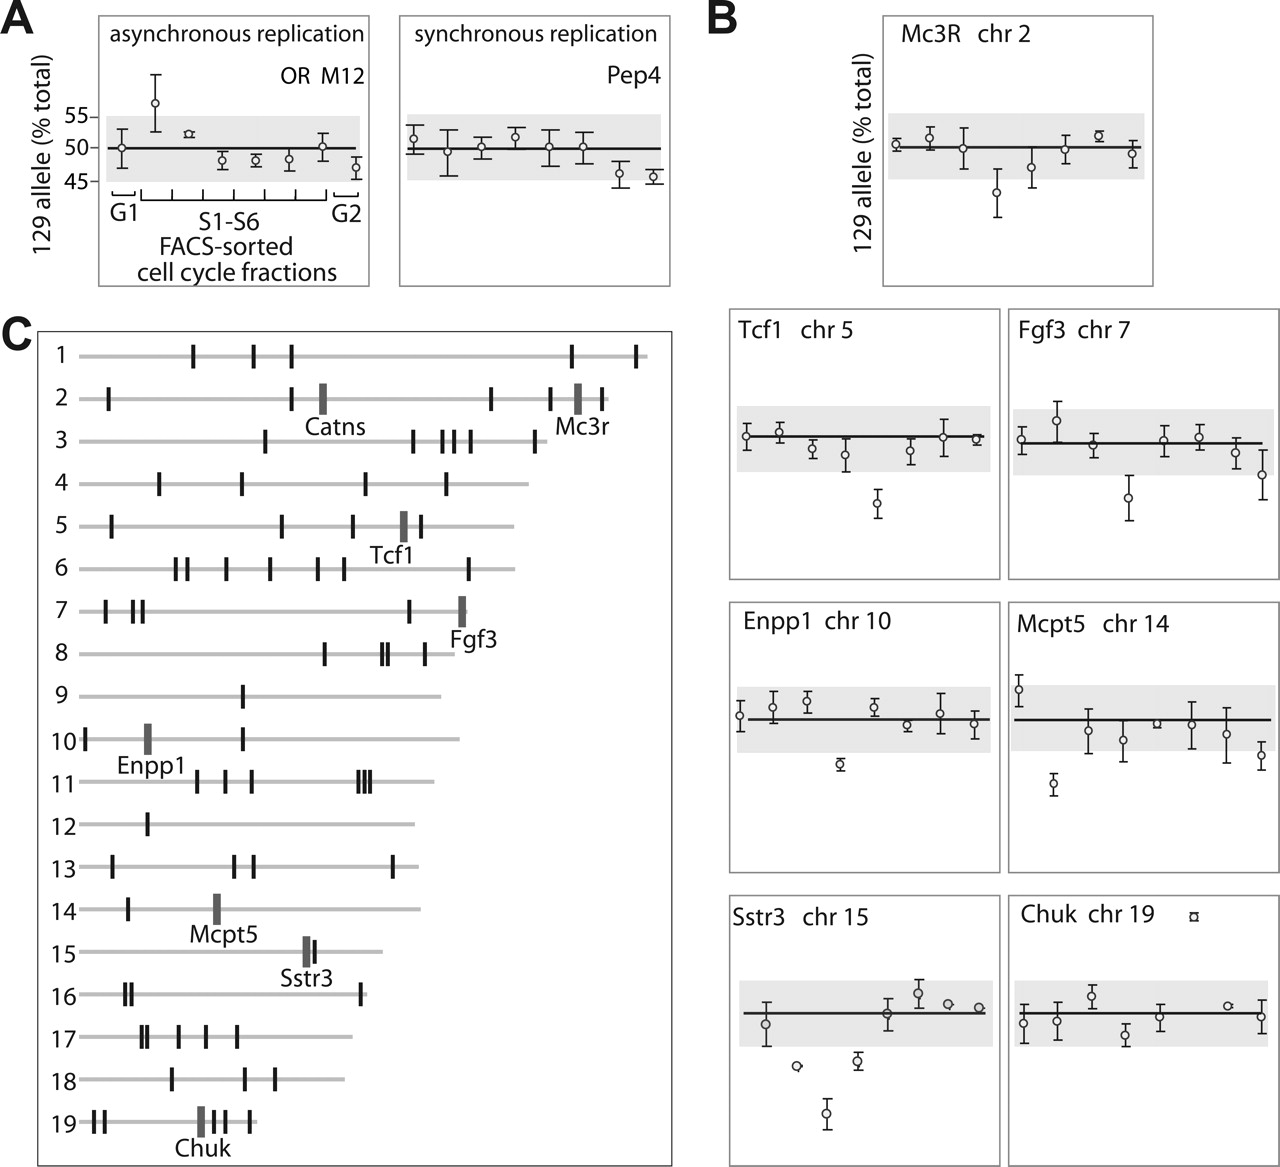
Survey of the mouse genome for asynchronous DNA replication. (A) Detection of asynchronous and synchronous replication by quantitative genotyping of cell-cycle fractions. An unsynchronized, clonal population of ES cells from 129×CastF1 mouse was FACS-sorted into eight fractions according to DNA content: G0/G1, G2, and six S-phase fractions. DNA from each fraction was analyzed for relative allele content in a SNP within a gene of interest using Sequenom primer-extension approach. For each cell-cycle fraction, the relative content of the 129 allele is shown (mean ± SEM; n = 4). To correct for detection bias and confirm linearity of allele detection, each experiment included known mixes of parental genomic DNA. Synchronously replicated genes, even those with noisy profiles such as Pep4 (currently Pepd), showed less then ±5% difference in any of the S-phase fractions. Known asynchronously replicated loci, e.g., M12 olfactory receptor (OR) had at least one fraction with one allele significantly more abundant than the other. See also Gimelbrant et al. (2005) for additional examples of replication profiles. Note that since we had prior knowledge of the OR replication timing status, these loci were only used as internal controls and were not included in the survey set. Based on the results for the ORs, a threshold of ±5% was chosen to distinguish synchronous and asynchronous replication (gray bar). (B) Replication profiles of novel asynchronously replicated loci identified in the survey. Replication profile of Catns (p120 catenin) obtained in the survey has been published elsewhere (Gimelbrant et al. 2005). (C) Distribution of the surveyed loci in the mouse genome. All the assessed loci (tick marks; the width of the marks is not to scale) are depicted according to their placement on the mouse genome assembly (NCBI build 33). The full list of assessed loci is in Supplemental Table S1. Acrosomes are to the left. Asynchronously replicated genes identified in this survey are denoted by larger tick marks and gene symbols.


